Seattle Municipal Archives Moving Images Manual: QCTools
- How to Use This Manual
- Introduction
- Graph Descriptions
- Artifacts
- Playback Filter Descriptions
- Tape Damage
- Glossary
This manual contains material from the following contributors:
A/V Artifact Atlas
Bay Area Video Coalition (BAVC)
BlackMagic Design
Moving Image Preservation of Puget Sound (MIPoPS)
Rosemary Carroll
Anne Frantilla
Libby Hopfauf
Hannah Palin
Rachel Price
Dave Rice
Seattle Municipal Archives (SMA)
Carol Shenk
(c) 2015 Seattle Municipal Archives
City Hall, 600 Fourth Avenue • Third Floor
Seattle, WA 98124-4728
(206) 233-7807 • (206) 684-8353
How to Use This Manual
Below are explanations of the information icons and color coding that appears throughout this manual. This is to help the user find what they need in an efficient and intuitive manner. A glossary of video and technical terms is located in the back of the manual, along with quick image reference of possible video artifacts.
ICON KEY
######## icon key
For Your Information
- Additional Resource
For Your Information: This icon will appear within a purple box throughout the manual to provide addition information about a section.
Additional Resources: This icon will mark places in the manual where addition information may be found in another section. For each reference, the section will be noted.
COLOR KEY
######## Color key
Purple Chapter Headings
Lavender Section Headings
Blue Actions
Orange Titles
Salmon Terms
Purple: Chapter headings
Lavender: Section headings
Blue: Actions, buttons, icons to click or select
Orange: Titles of programs, site, resource, and windows
Salmon: First occurrence of a glossary term
For more information on graphs and playback filters, consult the BAVC’s QCSchool: A blog series for users of QCTools. As of September 17, 2015, only two posts exist. As more are posted, I will incorporate them into the manual.
Introduction
 QCTools by double clicking the icon on the Dock.
Add Files: click the in the upper left hand corner and select the desired video file from the pop-up window. Once your files have been added, the preprogramed selection of graphs will begin running and you will see the lines begin to populate horizontally along each. Alternatively, you can open the Finder, navigate to the desired file, then drag and drop it into the program window.
Please Note: Sometimes QCTools only will let you add via one of these options. If one doesn’t work, try the other.
Select and Navigate Graphs

 Views: QCTools automatically opens in Graphs
Layout. To view a list of your current video files, click the View
tab on the toolbar and select File List. To return and view the
graphs for the most recently viewed file (not necessarily the most
recently added), click the View tab on the toolbar and select
Graphs Layout from the dropdown menu. While in File List (Table)
view, you can also double click on a file and you will be taken to a
Graphs Layout of the corresponding video. You can also access these
different views by clicking on the corresponding icon.
Views: QCTools automatically opens in Graphs
Layout. To view a list of your current video files, click the View
tab on the toolbar and select File List. To return and view the
graphs for the most recently viewed file (not necessarily the most
recently added), click the View tab on the toolbar and select
Graphs Layout from the dropdown menu. While in File List (Table)
view, you can also double click on a file and you will be taken to a
Graphs Layout of the corresponding video. You can also access these
different views by clicking on the corresponding icon.
Table (File View):
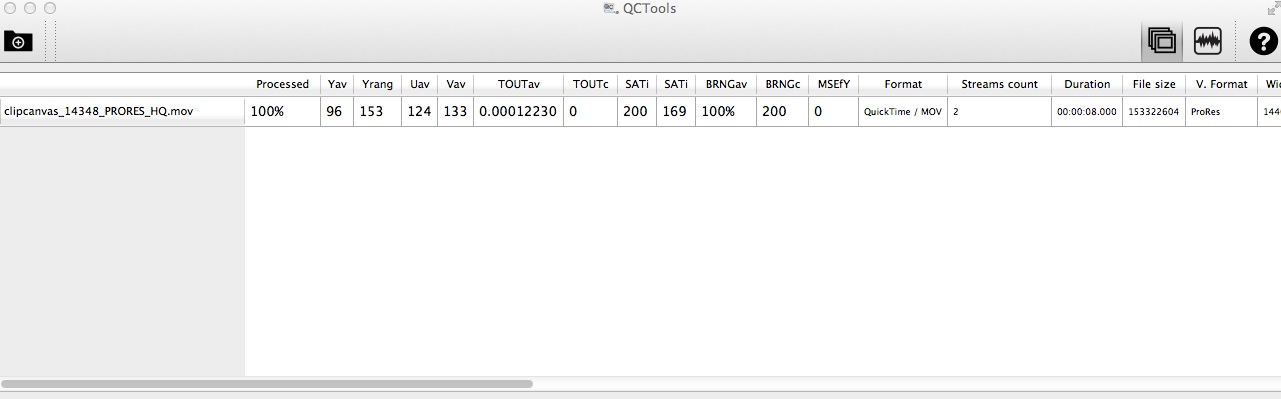
The Table View enables you to view the progress of your file download, plus associated metadata:
In addition to technical metadata about the file (duration, frame rate, file size, etc.) the List View also displays more detailed statistics about the averages of your video levels over the duration of the file. More columns exist, but the ones with information most helpful to you are listed below:
  Column Name        Description                                                                                                                  Ideal Range
  ——————             —————————————————————————————————————————-                                                                                   —————–
  Yav                The average of the Y values (128)                                                                                            ~128
  Yrang              The average of the YHIGH and YLOW values (YHIGH-YLOW), which indicates the overall range of contrast                         ~128-219
  Uav                The average of the U values                                                                                                  ~128
  Vav                The average of the V values                                                                                                  ~128
  TOUTc              The number of frames with a TOUT value of more than 0.005                                                                    <10
  SATb               The number of frames where the maximum saturation is over 88.7, which would indicate levels outside of the broadcast range   <1000
  SATi               The number of frames where the maximum saturation is over 118.2, which would indicate levels outside the legal YUV values    <1000
  BRNGav             The percentage of frames with a BRNG value of more than zero                                                                 <0.02
  BRNGc              The number of frames with a BRNG value greater than 0.02                                                                     <1000
  MSEfY              The number of frames with an MSEfY value over 1000                                                                           <10
When checking for ideal range numbers mentioned throughout this manual, use this view as an initial quick frame of reference.
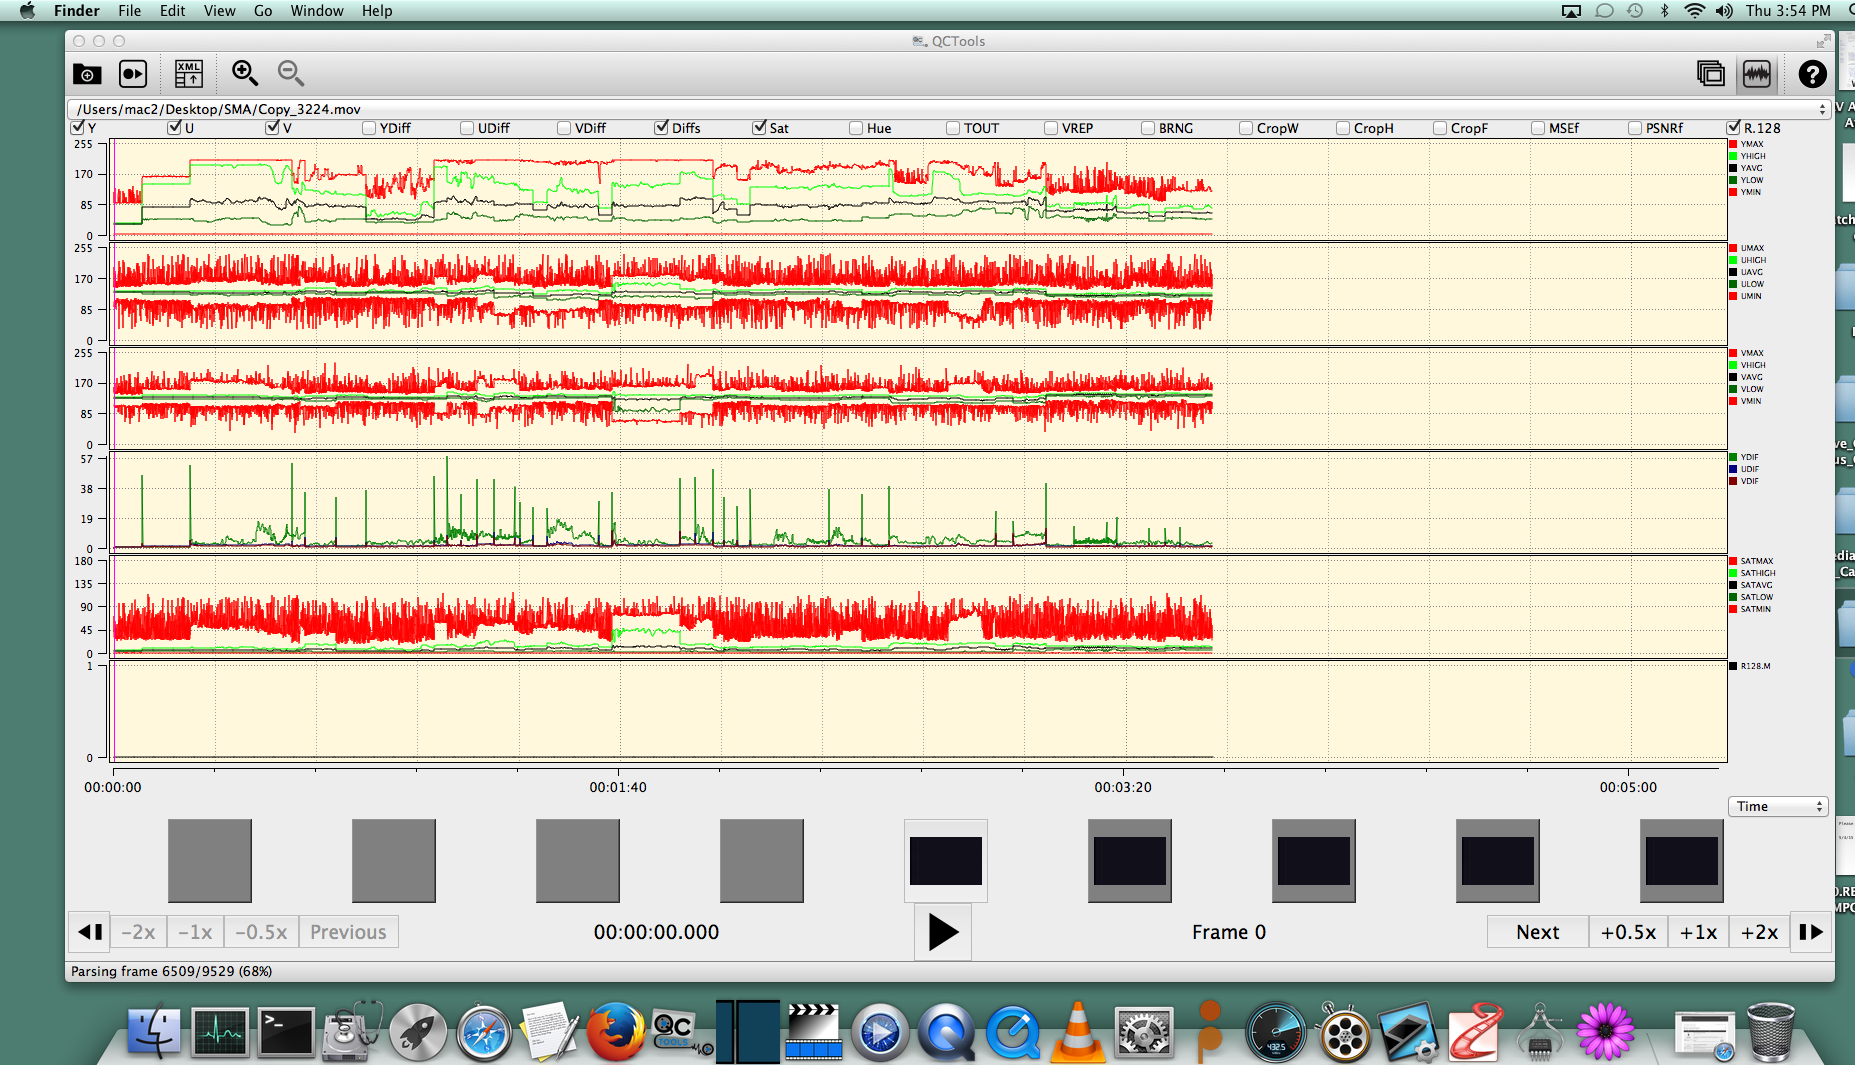
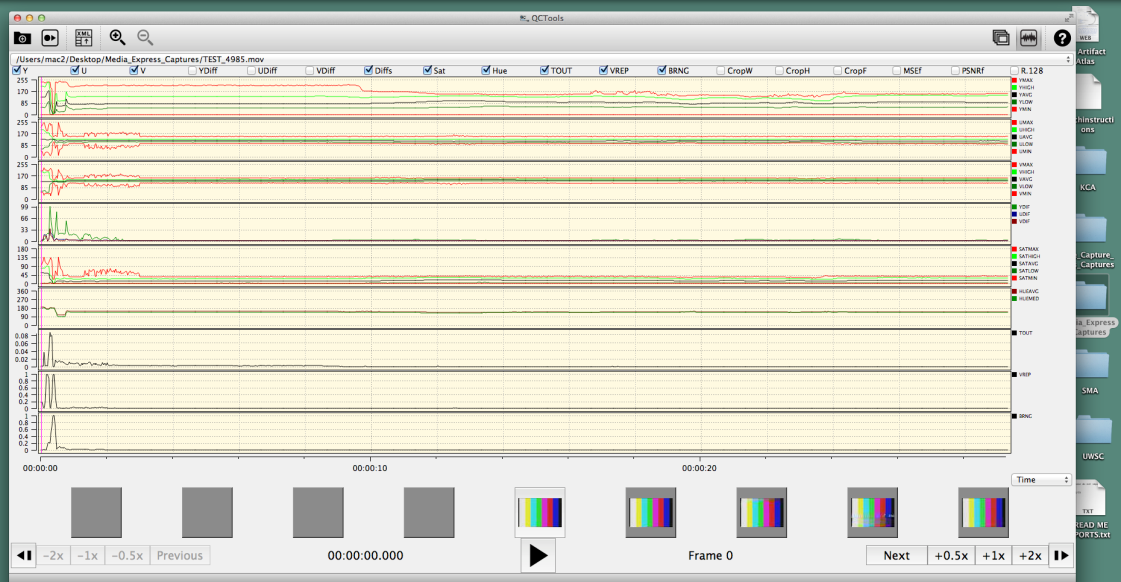
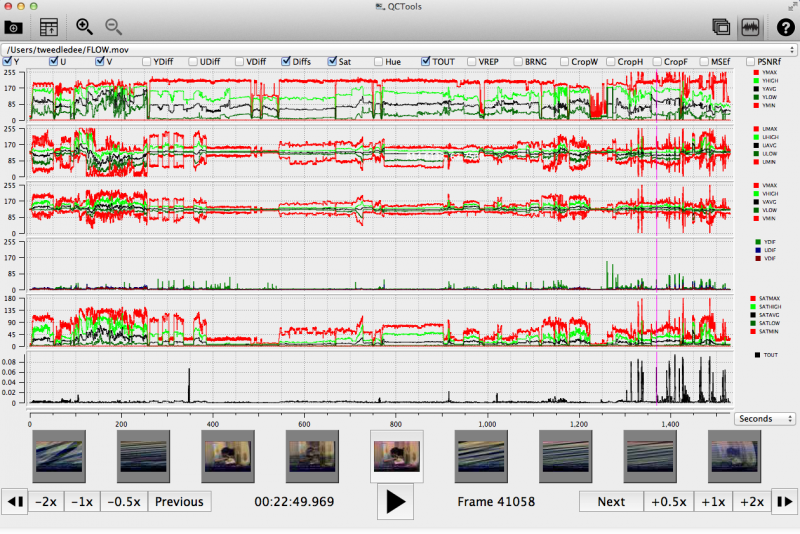
Graphs: Graphs display on the top portion of the screen, corresponding video thumbnails show below. The graph options (see image below) are located along the top of the window. Each title is followed by a check box. You can select or deselected any one(s) you want by checking or unchecking the corresponding box.
Video Thumbnails: these are the squares (thumbnails of each frame) scrolling along the bottom of the window. The video thumbnails may be navigated via the Next, Previous, or; the frame and time for the particular selection will be displayed below the center (or selected frame). Clicking and dragging your cursor over a portion of the graph will cause the thumbnails below to update accordingly to correspond with the information. You may also double click a specific thumbnail and the playback window will appear displaying the image and with a variety of analytical playback filters.
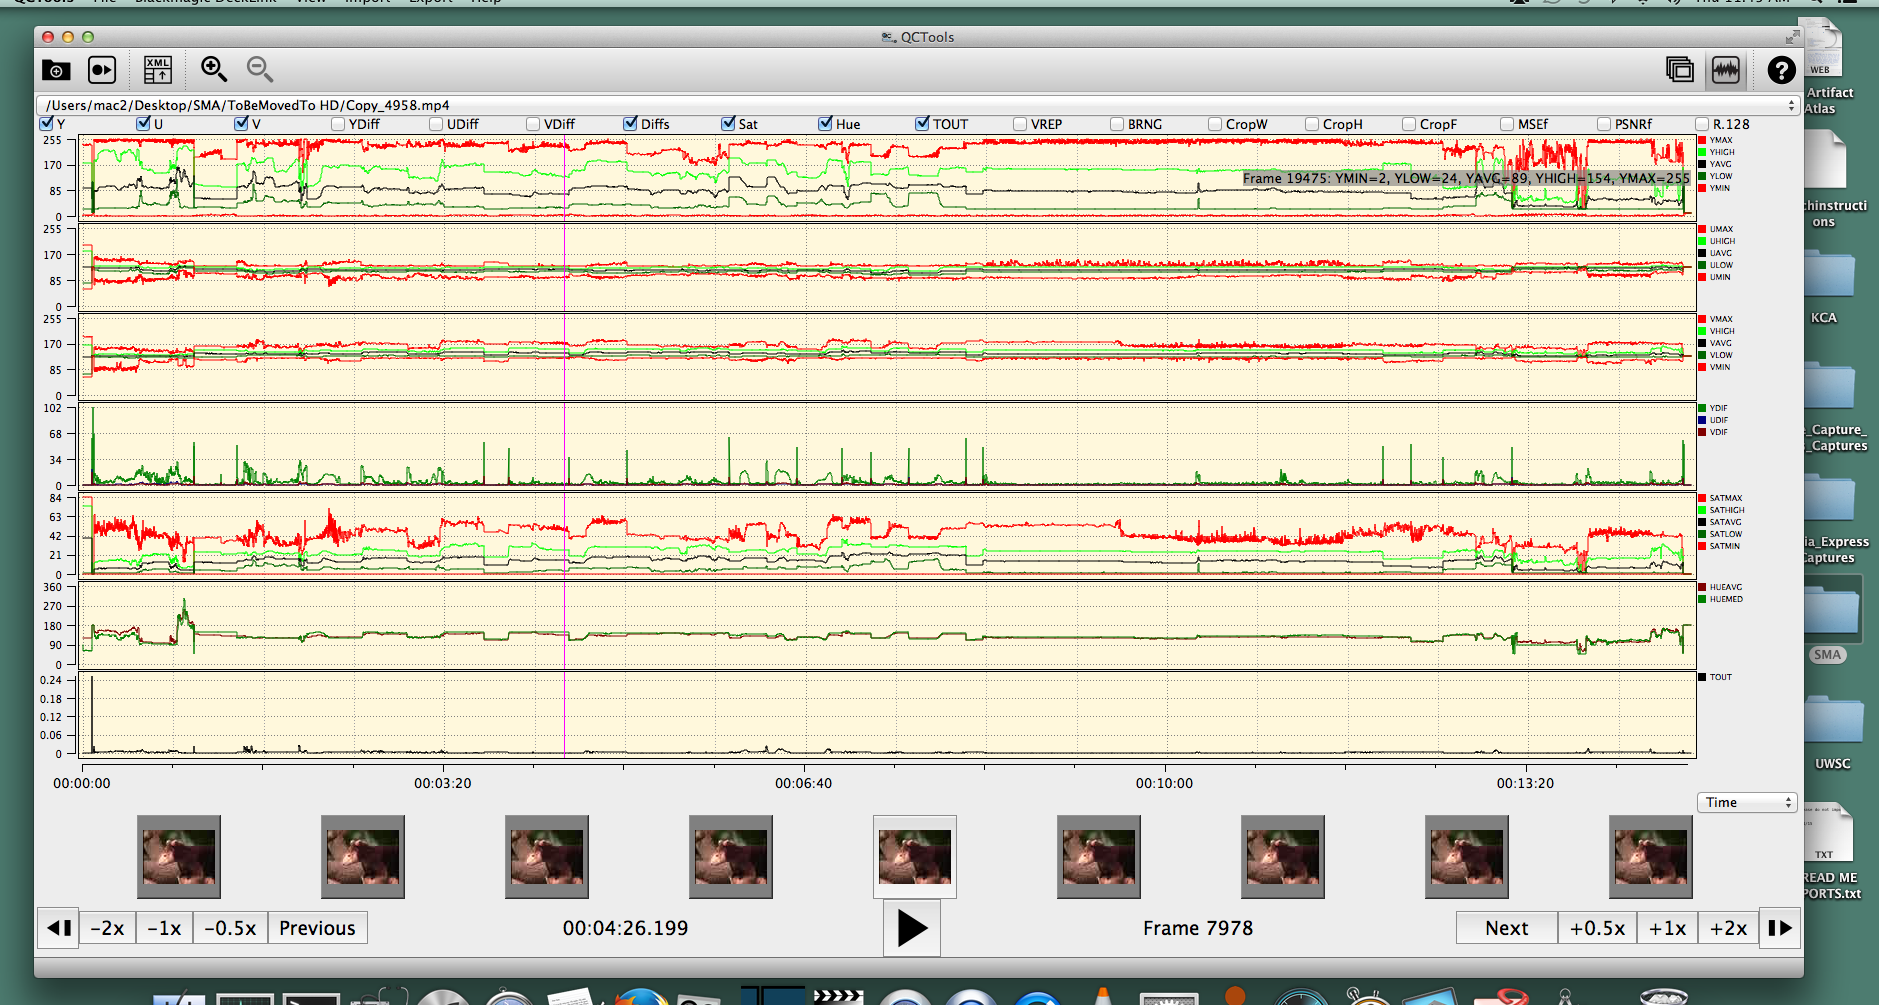
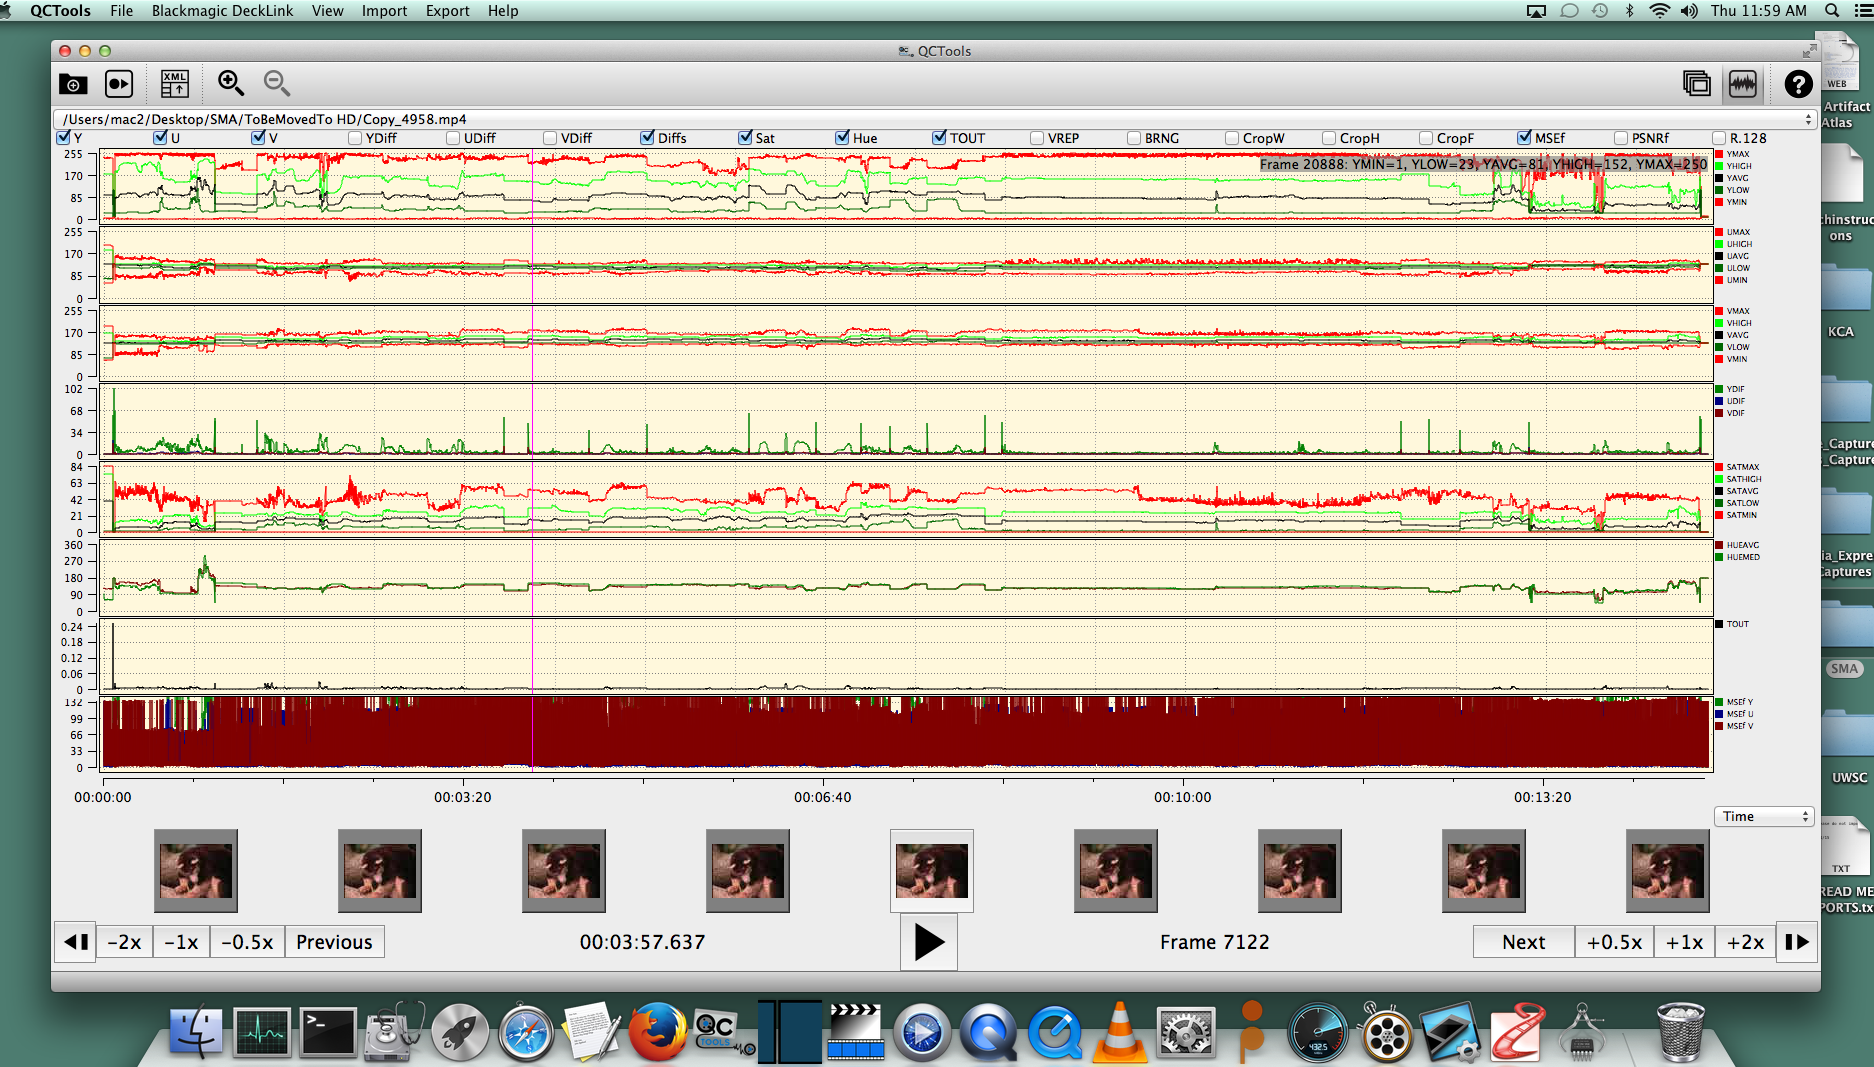 Levels: Moving your cursor over a
particular point on a graph will reveal thesymbol in place of your
cursor’s usual arrow. This symbol appears very faint and is sometimes
hard to see; also you might have to try clicking around on the graph for
it to appear occasionally. By moving the symbol around the graph(s) with
your mouse, numbers will appear within a translucent black box,
displaying the frame number and plot values for the lines with in the
occupied graph. For example, Frame 15212: HUEMED = 125, HUE AVG = 122
(see image on right). This is helpful when making adjustments to the
video because you are more precisely able to decipher levels at
different points in the video. By clicking on a certain area of the
graph, the playback will automatically go to that point in the video
(displayed in the current frame thumbnail at the bottom of the window).
Levels: Moving your cursor over a
particular point on a graph will reveal thesymbol in place of your
cursor’s usual arrow. This symbol appears very faint and is sometimes
hard to see; also you might have to try clicking around on the graph for
it to appear occasionally. By moving the symbol around the graph(s) with
your mouse, numbers will appear within a translucent black box,
displaying the frame number and plot values for the lines with in the
occupied graph. For example, Frame 15212: HUEMED = 125, HUE AVG = 122
(see image on right). This is helpful when making adjustments to the
video because you are more precisely able to decipher levels at
different points in the video. By clicking on a certain area of the
graph, the playback will automatically go to that point in the video
(displayed in the current frame thumbnail at the bottom of the window).
Zoom: You may also use the magnifying glass icons in the tool bar to zoom in/out, giving you a more or less detailed view of the graph displays, over a specific timespan of the uploaded video.
keyboard shortcuts for Playback
to (select the previous frame)
to (select the next frame)
F to enlarge the window to full screen
SPACE to toggle between and
Video Analysis Window
Playback Filters: to view a certain frame and apply the various filters, double click on the thumbnail you want from the row along the bottom and a pop-up window will appear with two views. This is called the Video Analysis Window. In the upper left and right hand corners are dropdown menus used to select the playback filter(s) corresponding to the screen on their respective sides.
Graph Descriptions
Vocabulary
Graphs: the QCTools “Help” documents refer to these graphs as “graph filters” or “filters”. In order to reduce confusion (since there are also “playback filters”) this manual refers to “graph filters” as “graphs”.
Plot: is used here to refer to both the lines on the graph and the action (verb) of the lines recording data (level values). Line(s) is also used as a synonym for plot(s).
Channels: the contributing factors or signals making up the video image.
Levels: are the measurements of each video channel/signal.
Values: refer to the unit of measurement and number of each level. The values detailed below are appropriate for the 8-bit video samples analyzed by this tool.
IRE: is a unit of measurement used in the analysis of composite video signals. Its name is derived from the initials of the Institute of Radio Engineers.
Introduction
In General: The QCTools graphs analyze the various values of an encoded video file in order to provide information about the appearance of the video based upon the levels of its channels. Each graph analyzes a given channel and records the level values throughout the video. These levels are plotted on the corresponding graph. By examining the graphs alongside the playback, you will be able to identify problematic points, what caused them, and, if possible, how to fix them.
Keep in Mind: Although some variations may apply depending on each tape, in general the lines on all of these graphs should remain relatively constant. On graphs with more than one plot (line), the lines should remain relatively close together (except Y). For each graph described below, there is an approximate ideal range for where the lines should appear on the graph. If the lines are not exactly in this spot, that is fine. The ideal range is merely a guide to help in scanning for errors. Once an abnormality is spotted on the graph, it makes it easier to use the playback filters to determine the cause and any possible solutions. Not all abnormalities indicate an error and not all errors can be fixed. Also, not all levels within the ideal range are always correct. This can be ambiguous and confusing. Use them as a guide, along with you judgement to make the video look as “good” as possible with the fewest artifacts (errors).
Additional Note: Some of the graphs include more than one plot. Refer to the color keys on the right-hand side of the window for details of each. In general, they range in the following order: MIN, LOW, AVG/MED, HIGH, MAX.
MIN = channel minimum
LOW = channel 10%\ AVG/MED = channel average/MEDIAN\ HIGH = channel 90%\ MAX = channel maximum
These measurements (low, minimum, maximum, high and average) are contextual to each video it is analysis. For instance, the average line is plotting the average level of Luma throughout the movie of the current file.
Descriptions
1. Y VALUES: Y MIN, Y LOW, Y AVG, Y HIGH, Y MAX
  Graph Domain        Graph Name(s)                        Values         Ideal Range
  ——————-             ————————————                         —————          ——————
  Y Channel           Y MIN, Y LOW, Y AVG, Y HIGH, Y MAX   0-255 IRE       16 IRE (Y LOW)
                                                                          128 IRE (Y AVG)
                                                                          235 IRE (Y HIGH)
Overview: Y Channels carry data about the brightness of a picture or Luminance (Luma). Problematic variance in Y Channel values will manifest as a picture that is either too light or too dark (contains noise). 8-bit video will have values falling in the range of 0-255 code values per pixel. A picture with well-balanced light levels will have an average (or mid-range Y Channel value) of around 128 (Y AVG). Graph readings outside of that range will indicate a picture that is either too bright or too dark. A Y Value of 0 would indicate total blackness and a value of 255 would present as entirely white. In the range of values, reference black is at value 16, while reference white is at value 235. The information plotted here will reflect a similar pattern to the Waveform monitor. Think of it like this graph is recording the movement of the trace from the Waveform on the BlackMagic Design Display.
On a Waveform, the Luma range is from 0-100 (7.5 to 100 Ideal). This information is converted to the 0-255 (16-235 Ideal) scale when it is digitized.
The Lines: The Y AVG, Y LOW and Y HIGH are the most important to pay attention to on this graph. The Y AVG gives you an overall understanding or feeling for the brightness of the video. The Y LOW and Y HIGH are similar to the Y MIN and Y MAX filters, but instead of looking at the absolute minimum and maximum value for these channels, it looks at the 10th percentile (LOW, or 16 pixels) and 90th percentile (HIGH, or 235 pixels) which present the outside limits or ‘headroom’ of the legal broadcast range. An extreme minimum or maximum value could dramatically skew the graph but because they may be outside the viewable broadcast image (or the range of human perception), they may not necessarily be meaningful indicators of a problematic visual image that can be human-detectable. This is why Low/High measurements are so useful– they ignore the extreme outliers (Min/ Max) in favor of those abnormalities which fall in the range of human perception. You want to make sure the Y LOW stays above 16 IRE and that the Y HIGH stays below 235.
How the Graph Should Look: Except during particular moments like scene changes where one might expect abrupt spikes, the values of Y channels should remain relatively stable or constant with little variation for the majority of the movie.
Sample of Ideal Range:
Exceptions: Portions of video showing extreme changes in average values (and not corresponding to a scene change or otherwise dramatic edit) likely indicate a picture error. Where you may expect Luma spikes could be camera fade-ins/outs, or a sudden brightness in the picture, like a camera flash, for example.
Samples which demonstrate Y Value anomalies:
2. U, V Values: U MIN, U AVG, U MAX/ V MIN, V AVG, V MAX **
  Graph Domain        Graph Name(s)         Values          Ideal Range
  ——————-             ———————               —————           ——————–
  U Channel           U MIN, U AVG, U MAX   0-255 IRE       85-170 IRE (U AVG)
  V Channel           V MIN, V AVG, V MAX   0-255 IRE       85-170 IRE (V AVG)
Overview: The U and V Channels represent the Chrominance (Chroma), or color differences of a picture. U and V graphs act to detect color abnormalities in video.
The Lines: It can be difficult to derive meaning from U or V values on their own, but they provide supplementary information and can be good indicators of artifacts, especially when occurring in tandem with similar Y Value readings. Black and white video contains no chrominance information so should present flat-lines (or no data) for UV channels. Activity in UV Channels for black and white video content, however, would certainly be an indication of chrominance noise (colorful speckled movement or unintentional placement). Alternatively, a color video which shows flat-lines (at 0) for these channels would be an indicator of a color drop-out scenario.
How the Graph Should Look: Except during particular moments like scene changes where one might expect abrupt spikes, the values of the U and V channels should remain relatively stable or constant with little variation for the majority of the movie. Spikes or extreme variation could be an indicator of odd glowing or noise.
Sample of Ideal Range:
Samples which demonstrate U/V Value anomalies:
3. YUV Values/ Difference
  Graph Domain        Graph Name(s)
  ——————-             ——————–
  Y Channel           Y DIF
  U Channel           U DIF
  V Channel           V DIF
Overview: This QCTools graph selects two successive frames of video and subtracts the values of one from the other in order to find the change, or difference, between the two frames (measured in pixels). This information indicates the rapidity with which a video picture is changing from one frame to the next. Prolonged spikes (lasting past the first few frames of a scene change) can represent a head clog.
How the Graph Should Look: All three lines should be relatively close together and smooth. Aside from scene-change scenarios, a video picture should not undergo dramatic changes in these values unless an artifact is present. A scene-change would present as a short but dramatic spike in the graph, and that is normal. Other YUV Difference spikes may be present in cases where picture problems are visible. Often, head problems with corrupted frames will result in large YUV Difference values/graph spikes. This is also a good way to double check your Chroma and Luma settings.
Samples which demonstrate YUV Difference anomalies:
4. Saturation
  Graph Domain        Graph Name(s)        Values        Ideal Range
  ——————-             ——————–              ————-         —————–
  Saturation          Sat                  0-180         0.00-88.7
Overview: Saturation is a measure of the degree to which a color is diluted with white light; in other words–how vivid or “true” a color is. Low Saturation levels (Undersaturation) can cause colors to be pale or washed out. Alternatively, when the Saturation levels are too high (Oversaturation), the colors can appear unnaturally vibrant and, sometimes, almost luminous. The Saturation graph is a good way to compare the YUV graphs. If the UV plots are all in their ideal range, but the Y graph and Saturation graph plots are not, this is an indicator that your Luma levels are too high and causing the vividness of the colors to be compromised. It can also be used to compare issues with Hue or Chroma.
A Vectorscope view is a good way to see Saturation data–a large plot area indicates much Saturation while a small plot area indicates little to none.
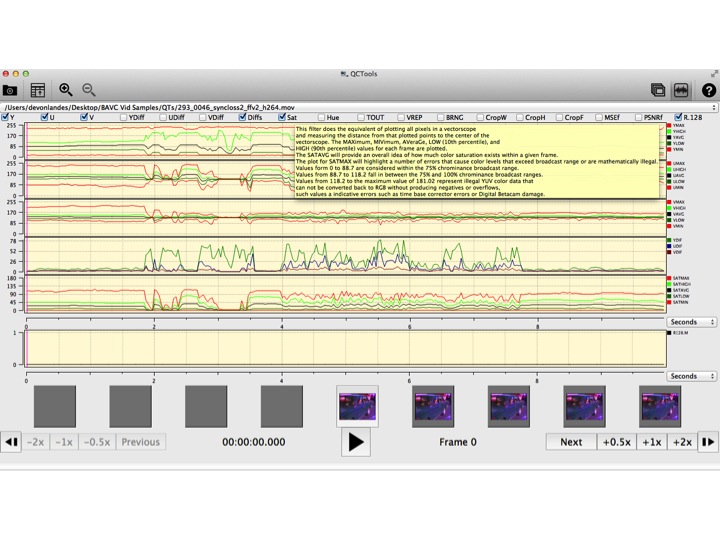
Ranges: This graph does the equivalent of plotting all pixels in a Vectorscope and measuring the distance from the plotted points (edge of the Vectorscope trace) to the center of the Vectorscope. The MAX, MIN, AVG, LOW and HIGH values for each frame are plotted. The SAT AVG will provide an overall idea of how much color saturation exists within a given frame. The plot for SAT MAX will highlight a number of errors that cause color levels which exceed broadcast range (are mathematically illegal). Values from 0 to 88.7 are considered within the 75% chrominance broadcast range. Values from 88.7 to 118.2 fall in-between the 75% and 100% chrominance broadcast ranges. Values from 118.2 to 180 represent illegal YUV color data that cannot be converted back to RGB without producing artifacts (negatives or overflows). This is usually caused by TBC error or tape damage.
For examples of Over/Undersaturation, see TBC Errors. For more information on Vectorscopes, consult the Vectorscope Playback Filter section and the Using the TBC with Scope Monitors in the Processing Manual.
5. Hue
  Graph Domain        Graph Name(s)        Values        Ideal Range
  ——————-             ——————–              ————-         —————–
  Hue                 Hue                  0-360°        120-147°
Hue is another term used to describe color. In analyzing video, skin tone is a good baseline to measure appropriate color representation and balance. The Y axis values for the Hue graph correspond with the degree measurements of the Vectorscope. Skin tone should fall in the 147° range. If skin tone registers significantly above or below that number, it’s likely an indication that your video isn’t accurately storing or displaying color data accurately. When used in conjunction with the Vectorscope, it is easier to adjust the Hue level to produce the correct colors.
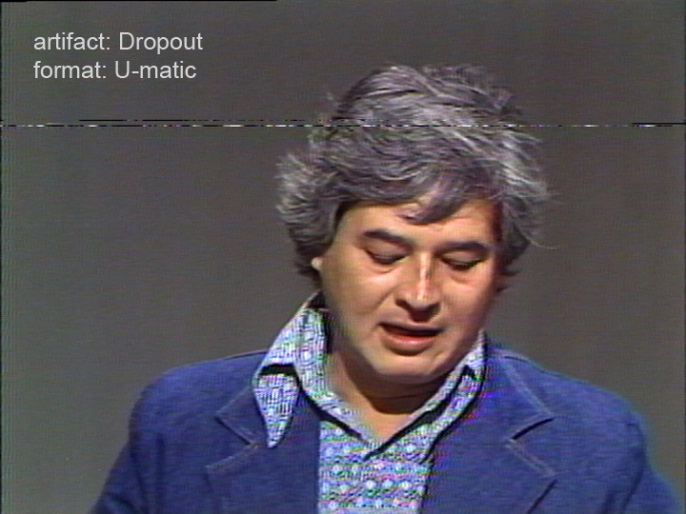
Please note: Hue can be very tricky. The numbers above for the suggested range are based on an image that is mostly of a person’s face/skin (all/any skin colors). Having other objects in a variety of colors will affect the reading. For example, if a person is wearing red, the hue average will be much higher (closer to 147⁰-150⁰) or if he/she is standing next to a bunch of trees on a bright day, the hue average will be much lower (closer to 110⁰-125⁰). Both of these colors can reflect onto the person’s and cause his/her skin to appear pink or yellow/green, even when the hue is in balance. This is most problematic with Umatic video
For Reference: the Hue filter measures G (green) at 38 degrees, Y (yellow) at 99 degrees, R (red) at 161 degrees, M (magenta) at 218 degrees, B (blue) at 279 degrees, and C (cyan) at 341 degrees.
Please Note: Until I have a chance to talk to Dave regarding this dramatic change, I would suggest using your best judgement, in conjunction with the Vectorscope and employ the looser range of 128-147⁰ when measuring Hue in QCTools. Through my research, I only came across small range (123-128⁰). I am not sure if Dave’s measurements correspond specifically to our equipment/QCTools or if there is something I am missing. More information soon.
Sample of Ideal Range:
For more information on Vectorscopes, consult the Vectorscope Playback Filter section and the Using the TBC with Scope Monitors in the Processing Manual. For more information on the Hue graph measurements, look up the Munsell Color System.
6. Temporal Outliers (TOUT)
  Graph Domain        Graph Name(s)        Values        Ideal Range
  ——————-             ——————–              ————-         —————–
  Temporal Outliers   TOUT                 0-1           0-0.009
Overview: This graph was created to detect white speckle noise in analog VHS and 8mm video. It works by analyzing the current pixel against the two above and below and calculates an average value. In cases where the filter detects a pixel value which is dramatically outside of this established average, the graph will show small spikes, or blips, which correspond to white speckling in the video. The range of 0-0.009 could be considered normal and anything above that range may be a quality error.
How the Graph Should Look: The plot should remain relatively flat and as close to 0 as possible.
Sample of Ideal Range:
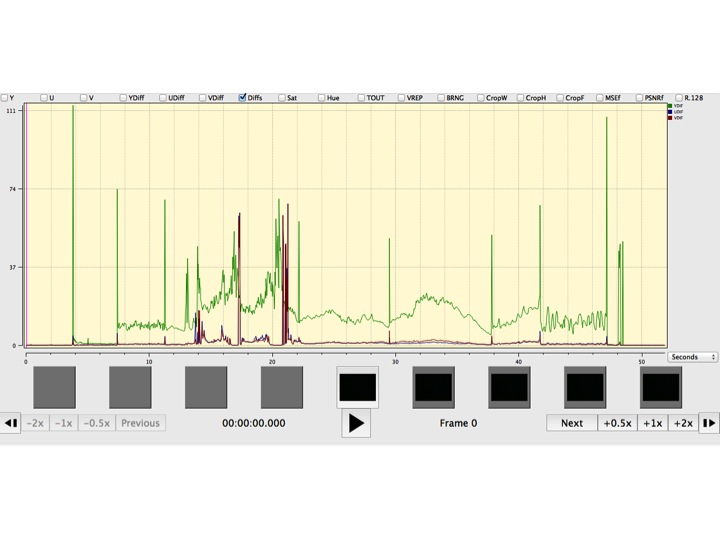
Samples which demonstrate Temporal Outliers’ anomalies:
You can see several blips in the graph reading, especially around 7.5s, 15s, and 24s
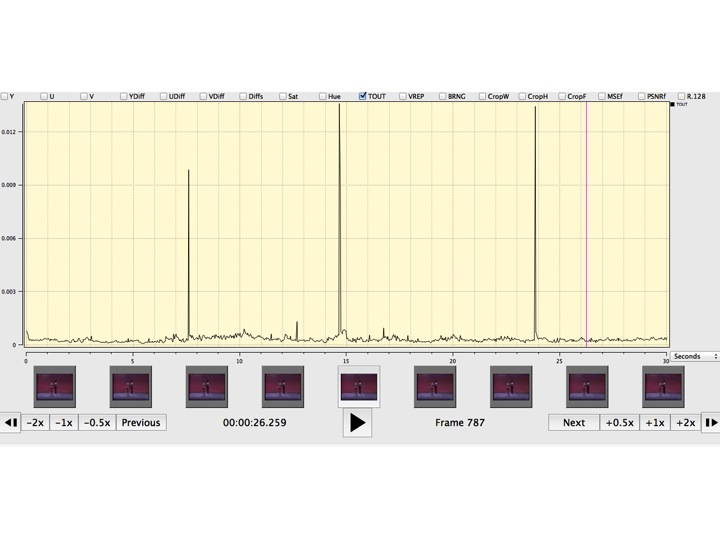
For more information on TOUT graphs and playback filters, consult the BAVC blog post QCSchool: All About TOUT.
7. Vertical Line Repetitions (VREP)
  Graph Domain                Graph Name(s)        Values        Ideal Range
  —————————                   ——————–              ————-         —————–
  Vertical Line Repetitions   VREP                 0-1           0
Vertical Line Repetitions, or the VREP graph, is useful in analyzing U-Matic tapes and detecting artifacts generated in the course of the digitization process. Specifically, VREP detects the repetition of lines in a video. If a time base corrector (TBC) notices a video signal dropout, it will compensate by playing the same line of data several times, hence the appearance of repetitious lines. The filter works by taking a given video line and comparing it against a video line that occurs 4 pixels earlier. If the difference in the two is less than 512, the filter reads them as being close enough to be appearing repetitious. Cleaning your deck and/or tape may remediate this problem.
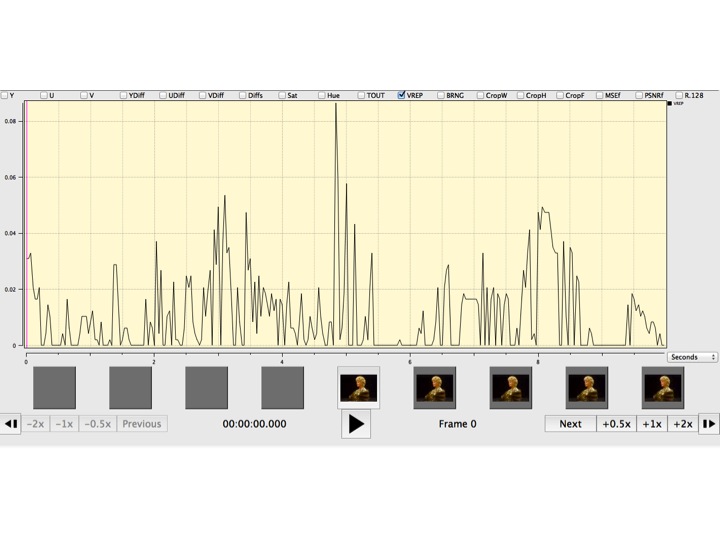
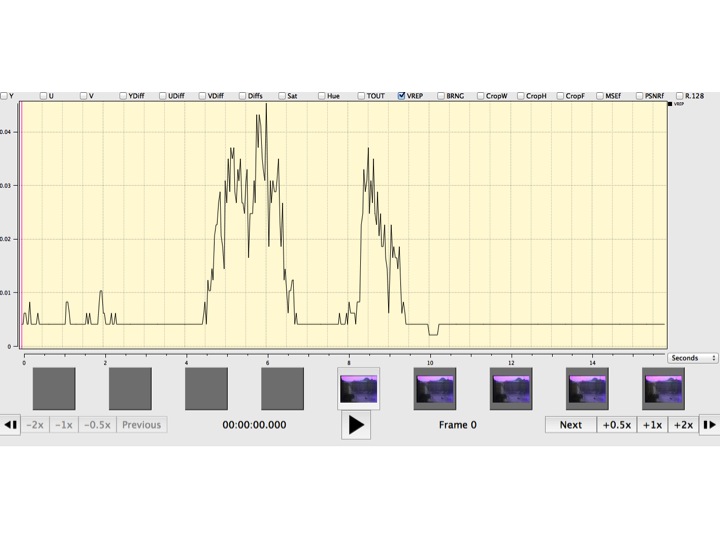
Sample of Ideal Range:
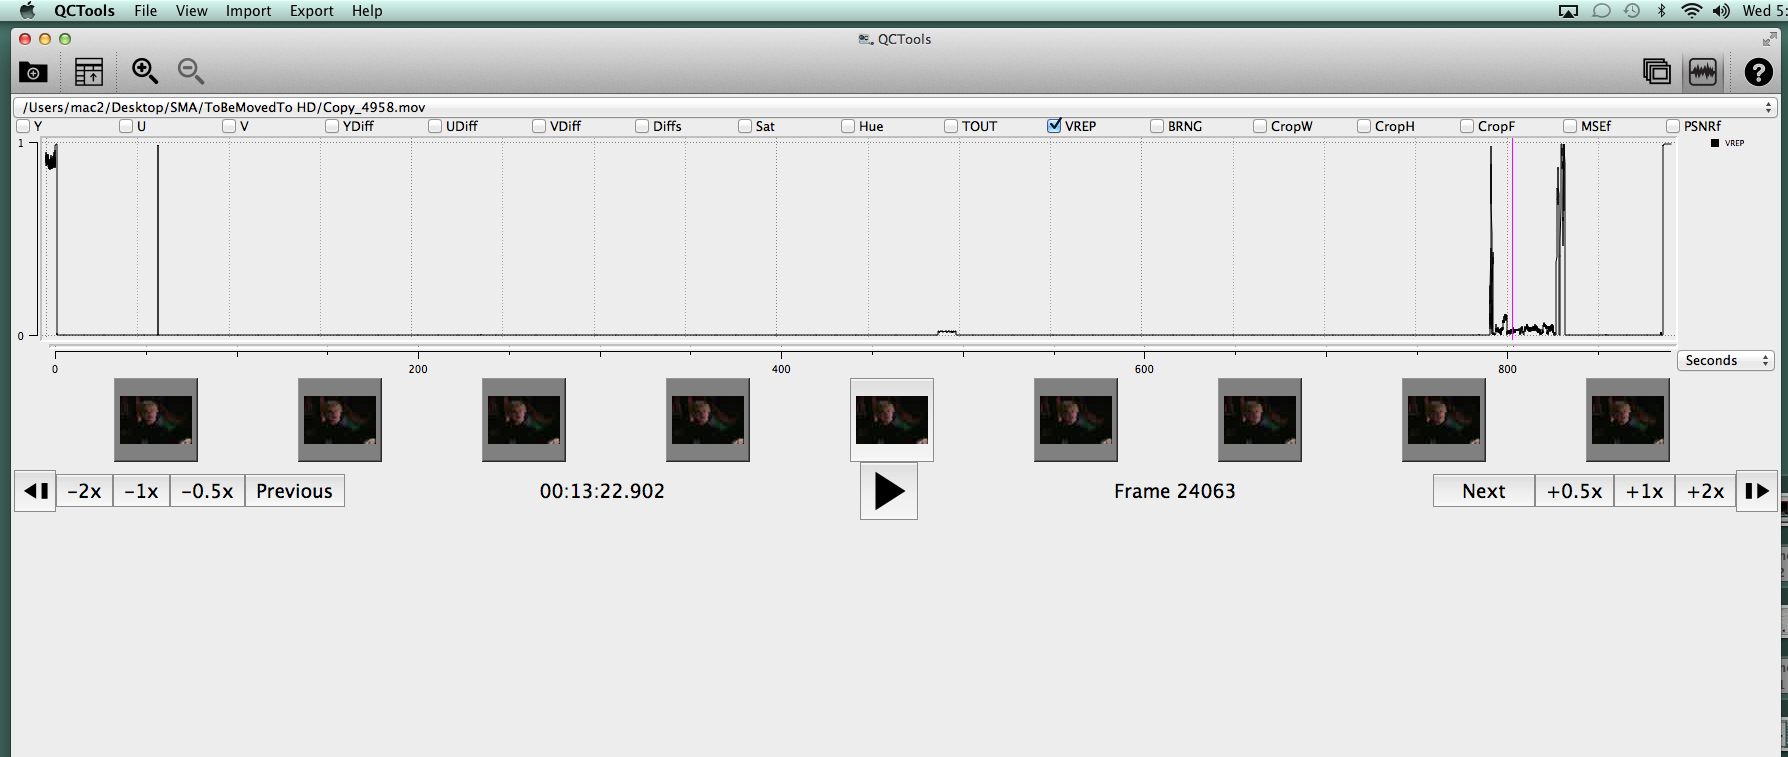
Samples which demonstrate Vertical Repetition anomalies:
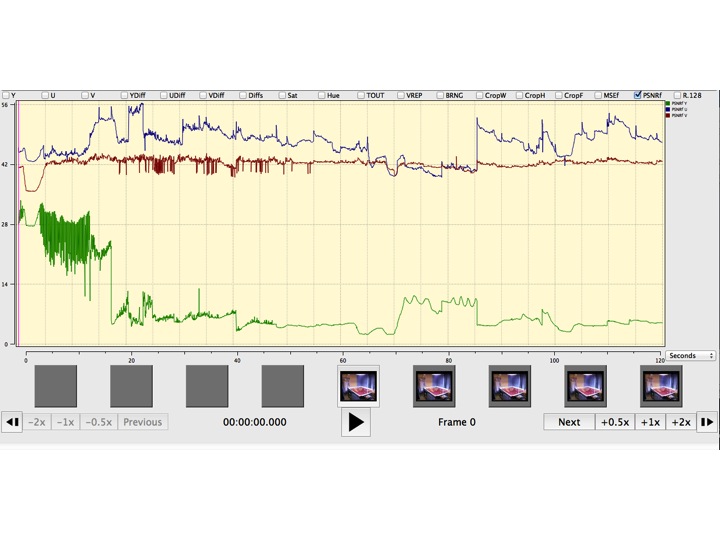
8. Peak Signal to Noise Ratio (PSNRf)
  Graph Domain                 Graph Name(s)        Value       Ideal Range
  —————————-                   ——————–              ———–        —————–
  Peak Signal to Noise Raito   PSNRf                0-60 dB     30-50 dB
This graph plots the Peak Signal to Noise Ratio between the video in Field 1 (odd lines) versus the video in Field 2 (even lines). PSNR is most commonly used to measure the quality of reconstruction of lossy compression codecs (e.g., for image compression). The signal in this case is the original data, and the noise is the error introduced by compression. When comparing compression codecs, PSNR is an approximation to human perception of reconstruction quality. Although a higher PSNR generally indicates that the reconstruction is of higher quality, in some cases it may not. One has to be extremely careful with the range of validity of this metric; it is only conclusively valid when it is used to compare results from the same codec (or codec type) and same content.
Typical values for the PSNR in lossy image and video compression are between 30 and 50 dB, provided the bit depth is 8 bits, where higher is better. Lower values indicate that Field 1 and Field 2 are becoming more different which would happen during a playback error (ex. head clog).
Sample of Ideal Range:
Samples which demonstrate Peak Signal to Noise Ratio anomalies:
9. Mean Square Error (MSEf)
  Graph Domain        Graph Name(s)        Range        Ideal Range
  ——————-             ——————–              ————         —————————
  Mean Square Error   MSEf                 0-1          As close to 0 as possible
This graph is meant to be used in the definition of the PSNR values. It reports on the Mean Square Error between Field 1 and Field 2. This is then used to calculate the PSNR. Higher values may be indicative of differences between the images of Field 1 and Field 2. In simpler terms, just want to make sure that this graph stays low and constant (as close to 0 as possible with few deviations) and that the PSNR stays between 30-50 dB. These two graphs are best used alongside others as supplementary information.
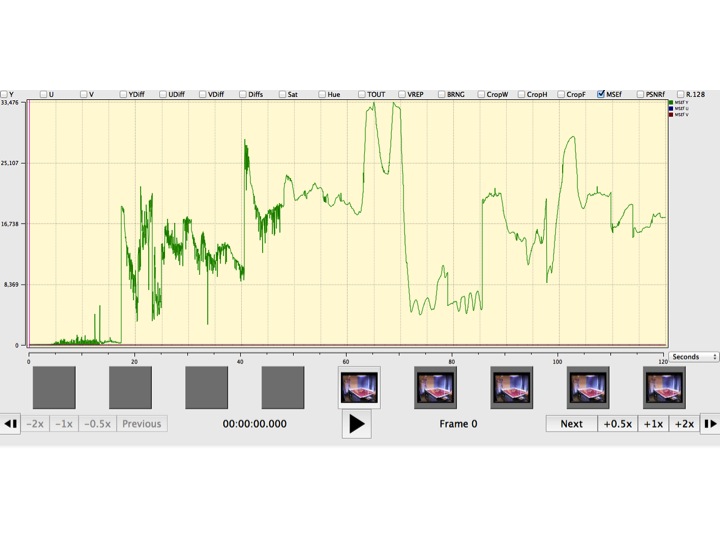
Samples which demonstrate Mean Square Error anomalies:
Playback Filter Descriptions
Introduction
The QCTools preview window is intended as an analytical playback environment that allows the user to review video through multiple filters simultaneously. Often inconsistencies within the graph layout may be better understood by examining those frames in the playback window. The playback window includes two viewing windows which may be set to different combinations of filters. This allows a user to playback a video by multiple forms of analysis simultaneously just as viewing a Waveform and a Vectorscope side-by-side or seeing the video with highlighted pixels that are outside of broadcast range while seeing the waveform display.
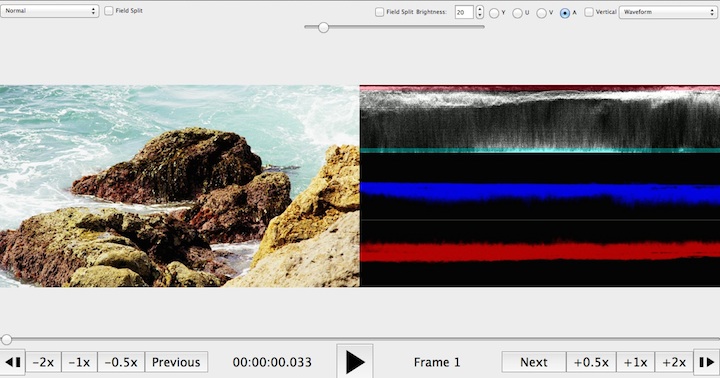
Field View: Many of the filters include the option of enabling Field. This display splits the two video Fields for the selected frame and shows them as separate images. Thus all odd-numbered video lines present appear on the top of the image and the even-numbered lines appear on the bottom (see right hand side of image below). To enable Field, click the checkbox next to the filter drop-down menu (when available). Older versions of QCTools called referred to this as “Field Split”.
Descriptions
1. No Display
This option enables you to remove one display, thereby only showing one view. This option allows a single playback window to occupy a greater amount of screen-space.
2. Normal
This view simply shows the video as QCTools interprets it, no special effects or filtering is added. In this view, you also have the option of enabling a Field display.
When to Use: Since many analog video errors occur differently between the two interlaced Fields, splitting the Fields into two distinct images can make it easier to see if a given error is caused by the analog video playback device (such as a head clog where the two Fields would react very differently) or tape damage (where the two Fields would react similarly).
What to Look For:

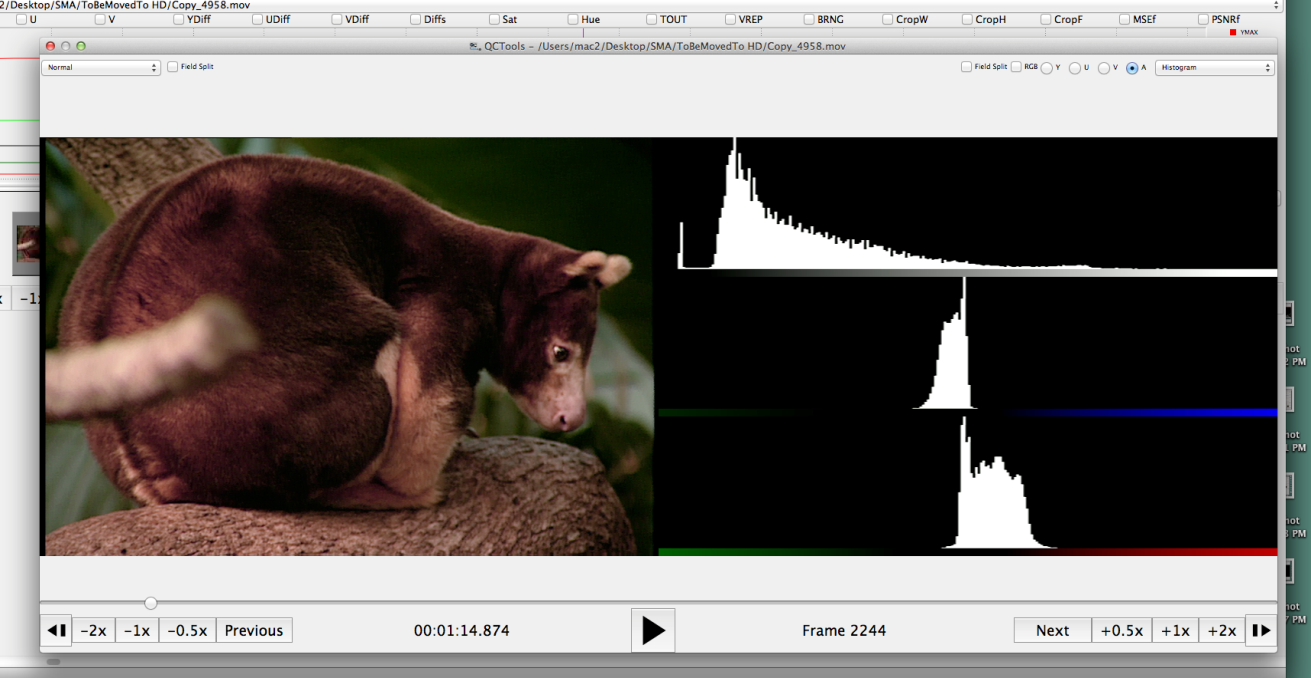
3. Histogram
The histogram charts the exposure and brightness of the video image. When you select this filter, check the RGB box. Typically the histogram will show one graph per channel (one for each Y, U, and V or one for each red, green, and blue). You can look at all 3 at once (check A box) or each individually. You may also select Field option which will depict Fields 1 and 2 separately (Field 1 on top, Field 2 on bottom).
The graphs all show the levels of each channel from lightest to darkest. This means that the height of the plots on the left correspond to the dark parts of the image in that channel and the right corresponds to the lighter parts of the image. Video with a lot of contrast and a well distributed range of luminance values will result in a histogram with an even spread. The height or number of peaks and valley is not important. You want to make sure that the plots extend fully between the left and right. If the ends of the plots are bunched up and climbing against the end of the graph display, this most likely means that your image is overly bright and clipping has occurred.
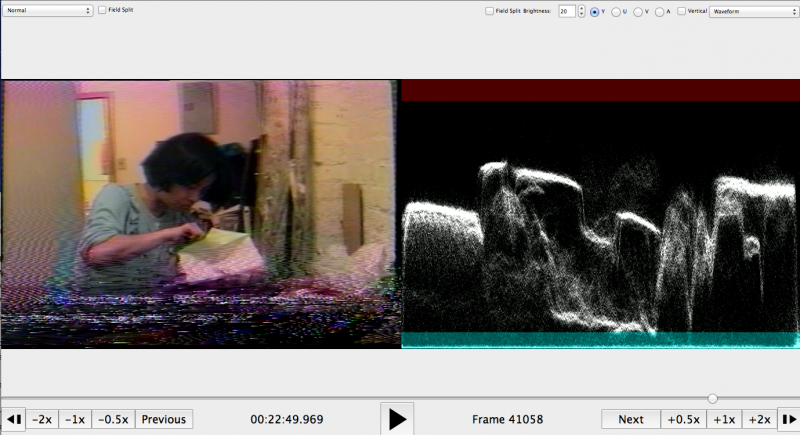
4. Waveform
The Waveform displays a graph showing the signal intensity in the video clip. The horizontal axis of the graph corresponds to the video image (from left to right) and the vertical axis is the signal intensity in units called IRE (named for the Institute of Radio Engineers). The numbers on the right vertical axis correspond to the range percentage (0-100%).
The Waveform displays luminance (Y Channel) information as a waveform. Bright objects produce a waveform pattern near the top of the graph; darker objects produce a waveform toward the bottom. For NTSC video in the United States, luminance levels should range from 7.5 to 100 IRE (sometimes referred to as the legal broadcast limit).
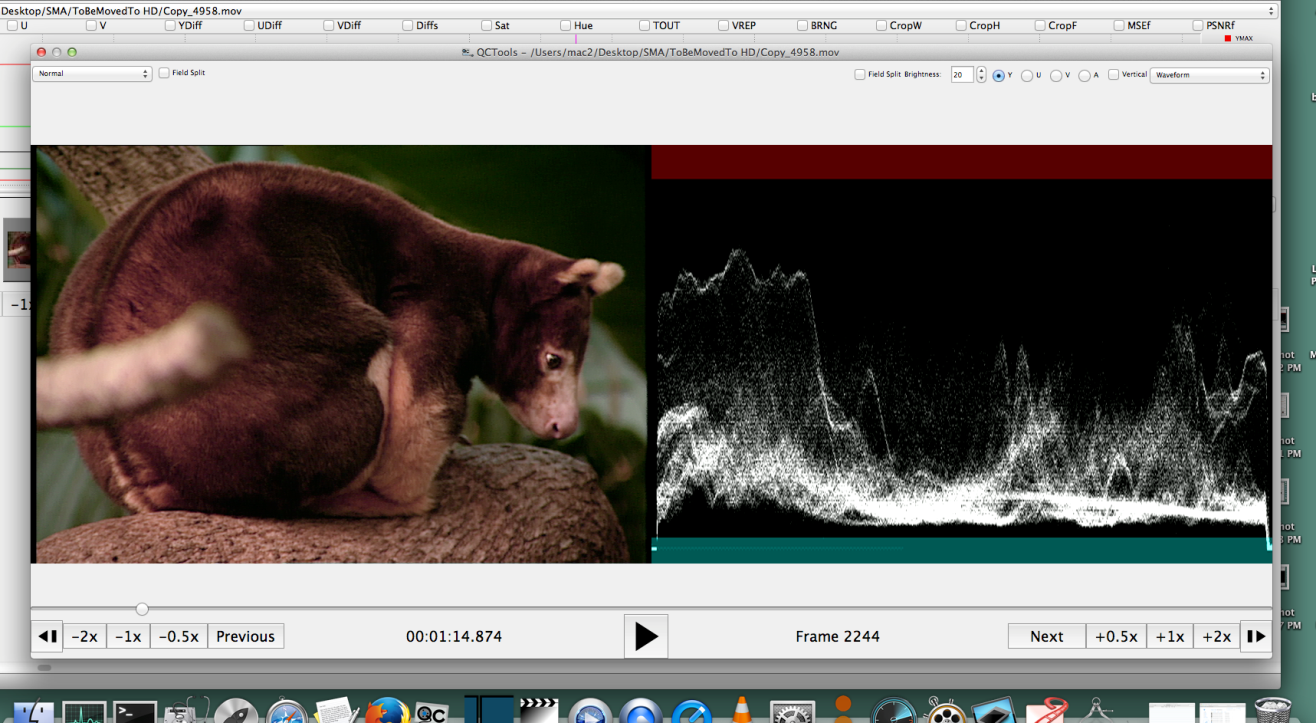
The waveform monitor is a graphical representation of the image, showing Luma values in the same position relative to those within the frame. For example, if part of your sky is overexposed you will see it in the same horizontal position on the waveform display as it appears in the frame.
Depending on your footage, your waveform will look different. If you are monitoring video which is high contrast, you might not see any values in the mid grays. The picture on the left shows a waveform for an evenly exposed image with a dark patch on the left and brighter values from the center of the frame out to the right. The trace should not go above 100 or below 0. However, sometimes analog video will have a black border around the image; it is okay if the border goes below 0%.
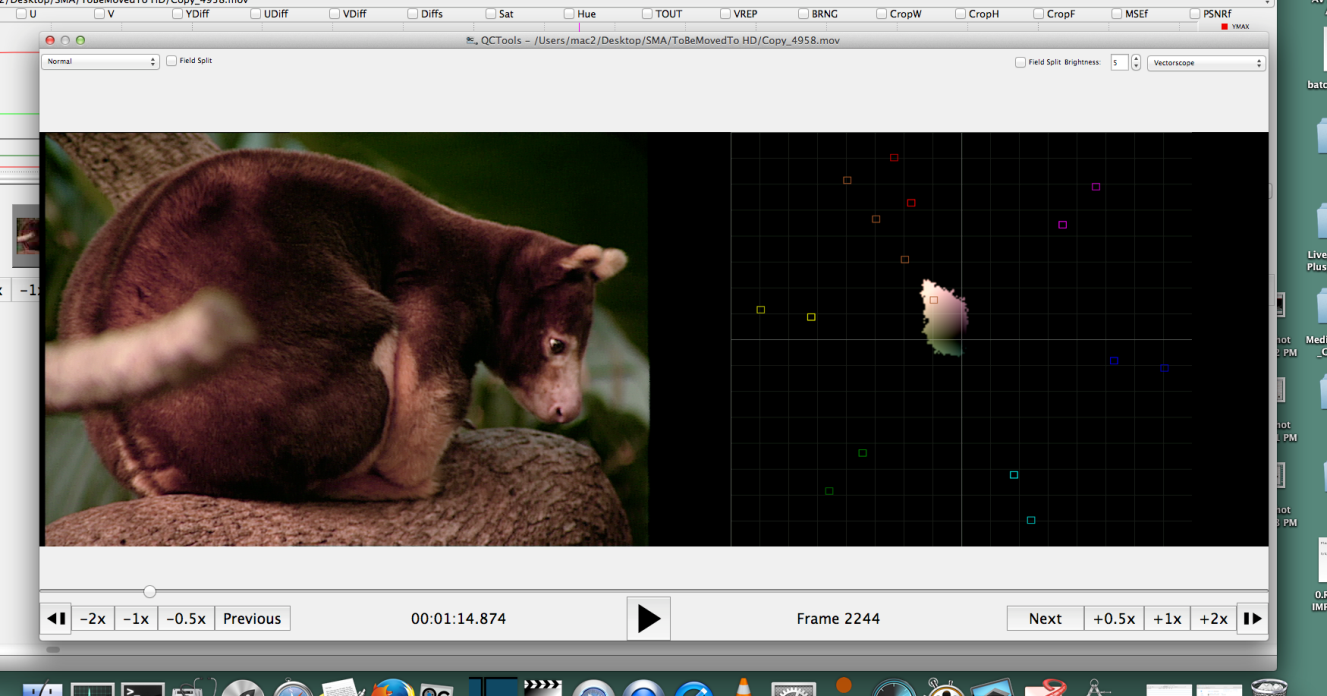
5. Vectorscope
The Vectorscope displays a circular chart, similar to a color wheel that shows the video’s chrominance information (U and V Channels).
Saturation is measured from the center of the chart outward. Saturated, vivid colors produce a pattern some distance from the center of the chart, while a black-and-white image produces only a dot at the center of the chart.
The particular color, or hue, of the image determines the direction (angle of the pattern). Small target boxes [ ] indicate where fully saturated magenta, blue, cyan, green, yellow, and red (present in a color bars test pattern) should appear. In NTSC video, chrominance levels should not exceed these target areas.
You may also select Field option which will depict Fields 1 and 2 separately (Field 1 on top, Field 2 on bottom).
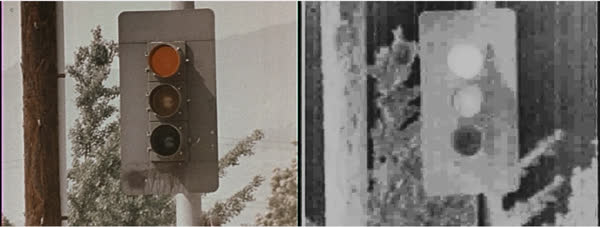
6. Extract Planes Equalized
 & Extract Planes UV Equalized
The Extract Planes Equalized filter extracts a specified video plane (such as Y, U, or V) which represents the Luma or part of the Chroma data from the video so that it may be reviewed on its own. The filter also may apply histogram equalization to redistributes the pixel intensities to equalize their distribution across the intensity range (this feature can help exaggerate or clarify the details of the plane image). This filter is useful for detecting lossy compression in video signals or establishing provenance.
The Extract Planes UV Equalized filter is similar to the Extract Planes Equalized filter but shows the two Chroma planes (U and V) side by side.
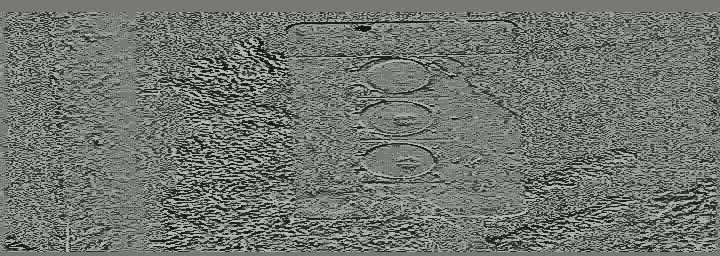
7. Bit Plane
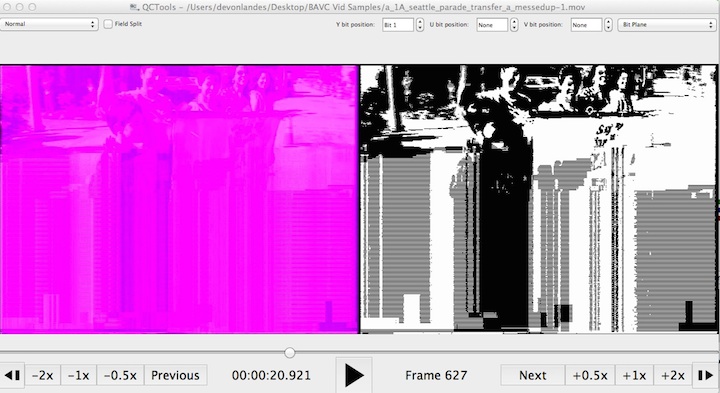 This filter selects the bit position of
each plane for display. Selecting ‘None’ for a plane will replace all
values with 0x80 (middle gray for Y and no color for U or V). Selecting
‘All’ will send the display plane as is. Selecting ‘Bit [1-8]’ will
display only that specific bit position of each pixel of the plane. For
the Y plane a pixel will display as black if that bit is ‘0’ or white if
that bit is ‘1’. For U a pixel will be yellow-green if ‘0’ purple if
‘1’. For V a pixel will be green for ‘0’ and red for ‘1’. Generally
lossy video codecs will show blocky structured patterns at higher
numbered bit positions. (Video sample and permission to use provided by
seattle.gov)
This filter selects the bit position of
each plane for display. Selecting ‘None’ for a plane will replace all
values with 0x80 (middle gray for Y and no color for U or V). Selecting
‘All’ will send the display plane as is. Selecting ‘Bit [1-8]’ will
display only that specific bit position of each pixel of the plane. For
the Y plane a pixel will display as black if that bit is ‘0’ or white if
that bit is ‘1’. For U a pixel will be yellow-green if ‘0’ purple if
‘1’. For V a pixel will be green for ‘0’ and red for ‘1’. Generally
lossy video codecs will show blocky structured patterns at higher
numbered bit positions. (Video sample and permission to use provided by
seattle.gov)
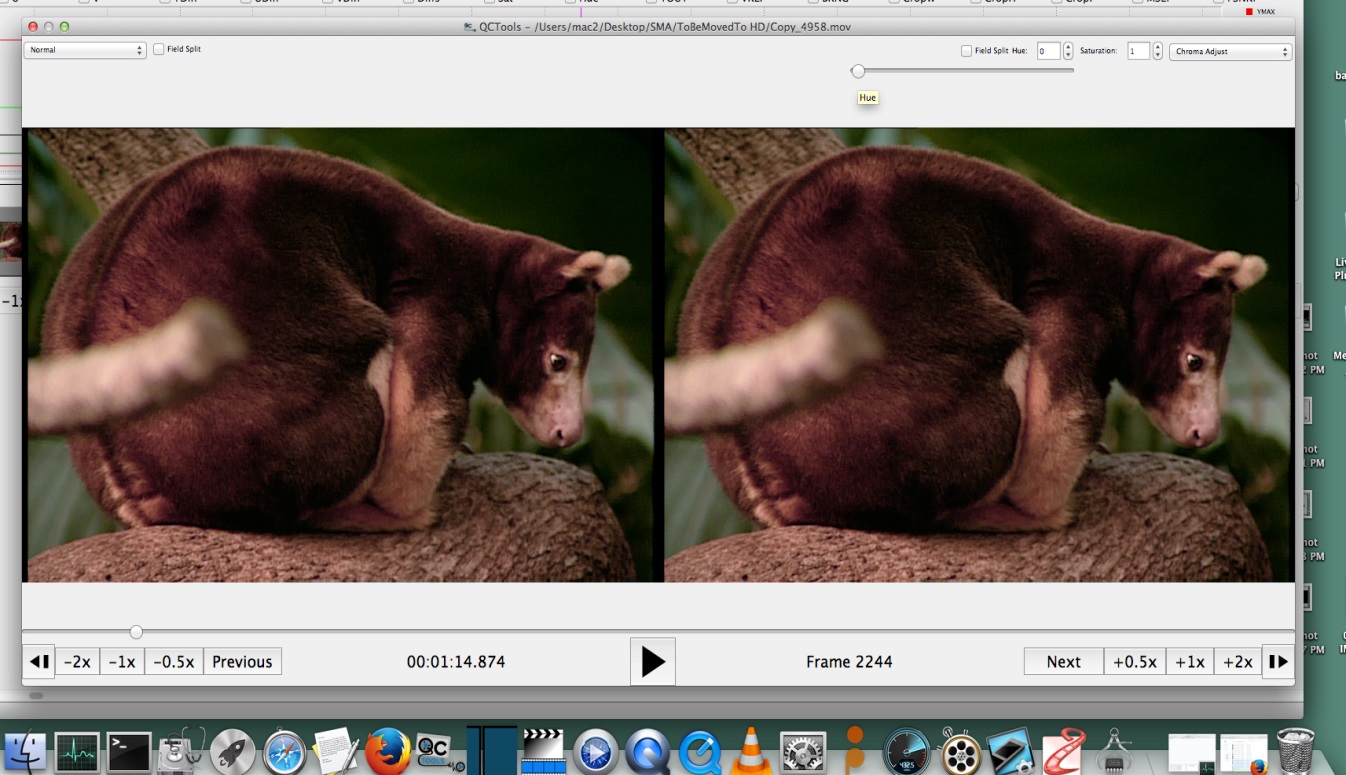
8. Chroma Adjust
This filter enables the Hue and Saturation levels to be adjusted. Hue adjustments may be expressed in degrees where 0 is no change and 180 would invert the color. For Saturation a value of 1 leaves the Saturation unchanged, 0 removes all color, and the Saturation may be increased up to a maximum of 10.
9. Field Difference
This presentation visualizes the difference between video Field 1 and Field 2. A middle gray image would mean that Field 1 and Field 2 were identical, whereas deviation to white or black indicates a difference.
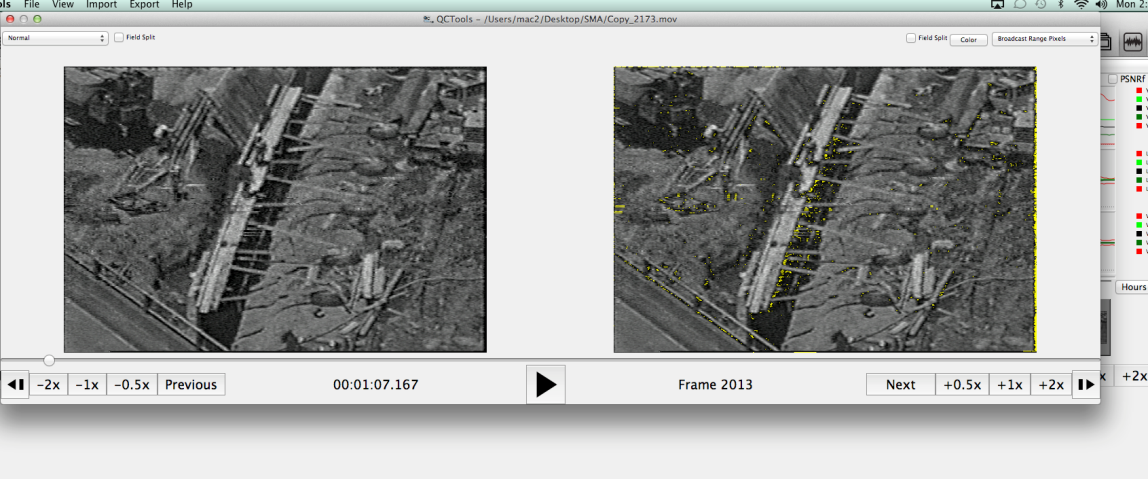
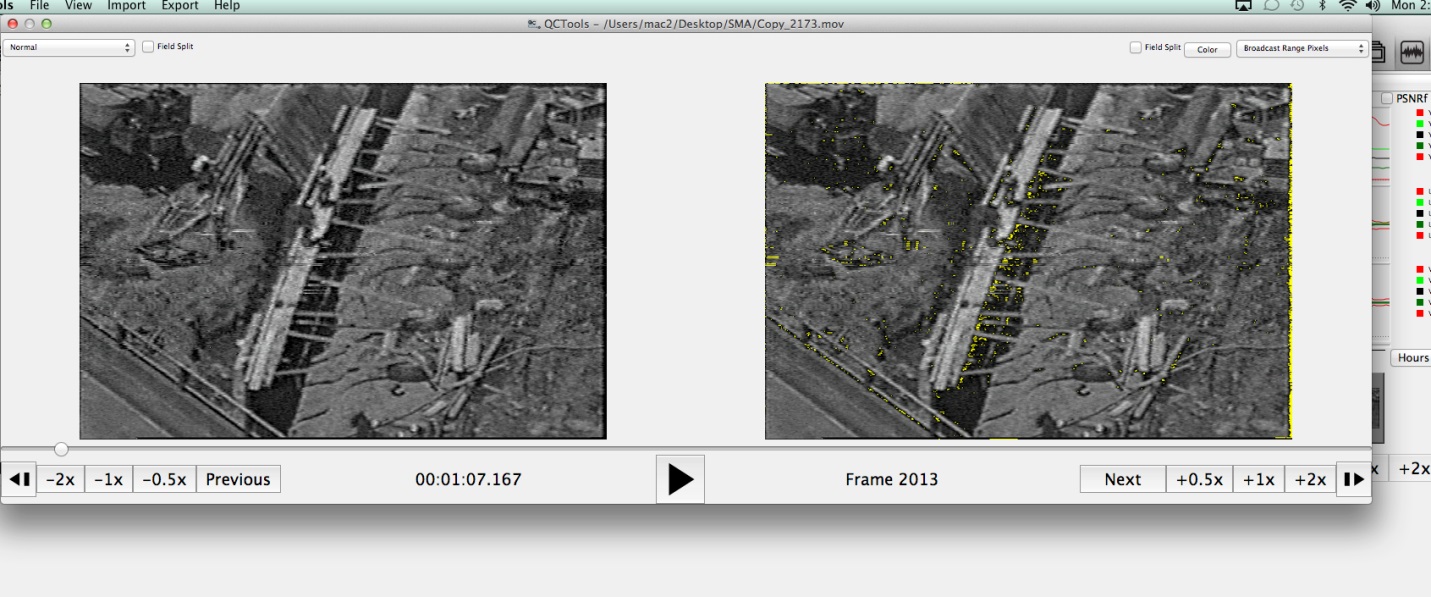
12. Broadcast Range Pixels
This is the same presentation as ‘Normal’ except that pixels that are outside of broadcast range are highlighted as white. This can often correspond to Luma noise. Again here, you have the option of selecting Field to display Field 1 (top) and Field 2 (bottom) separately.
13. Broadcast Illegal Focus
For video that uses the YUV colorspace and decode in a broadcast range. Values from 0-16 (on an 8 bit scale) will all decode to black on a computer monitor, while values from 235-255 will decode as white. This filter allows the users to select to feature pixel data that is outside of broadcast range. Select “above whites” to set pixels with Luma values from 236-255 to a range of grays (while all other pixels are set to black). Select “below black” to set pixels with Luma values from 0-15 to a range of grays (while all other pixels are set to black). If a video frame only contains pixels that have Luma values within broadcast range, then this filter will play black only black pixels. This filter portrays broadcast range compliance in somewhat the opposite way as the “Broadcast Range Pixels” filter since it focuses on values that may be crushed to black or white because they fall outside of broadcast range. Note that some videos may intentionally be encoded in ‘full range’ where this filter is less relevant.
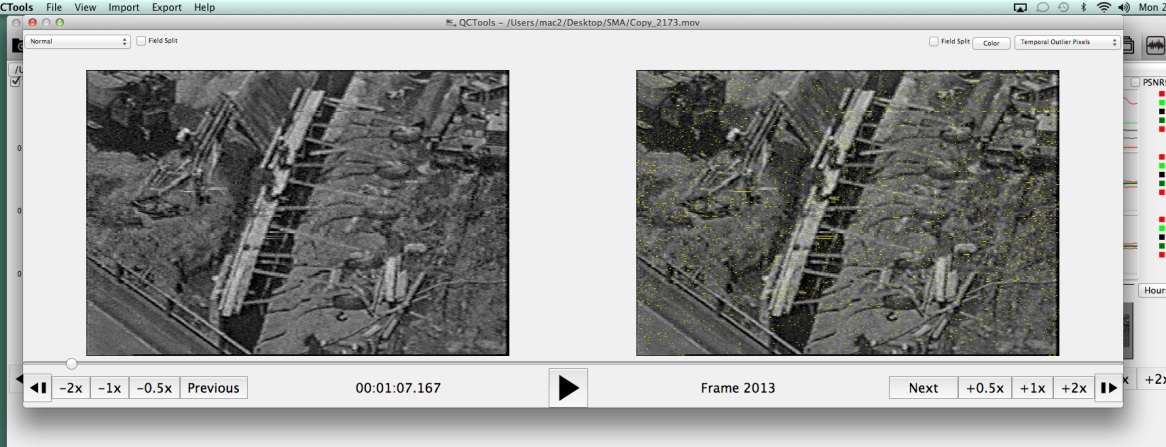
14. Temporal Outlier Pixels
This filter was created to detect white speckle noise in analog VHS and 8mm video. This is the same presentation as ‘Normal’ except that pixels that are labelled as temporal outliers are highlighted as white. Temporal outliers are pixels that significantly differ from their neighbors and often correspond to tape damage or playback error. When used in conjunction with the Broadcast filters above, you can determine whether the white noise in your video is caused by tape damage or Luma levels. Select Field to see the Fields displayed separately.
For more information on TOUT graphs and playback filters, consult the BAVC blog post QCSchool: All About TOUT.

15. Vertical Line Repetitions **
This filter displays repetitive lines of video data. This information is useful in analyzing U-Matic tapes and detecting artifacts generated in the course of the digitization process or through tape damage. For example, in the image below, on the left, you can see that the lines of distortion running across the image correspond to horizontal yellow bands across the image on the right. This indicates that the tape is damaged or the player is dirty. It helps to run this filter over any video that you think looks off to immediately rule out tape/player issues.
Artifacts
Vocabulary
Artifact is being used in the context of this manual to describe anything problematic which may occurring during playback or capture which compromises the quality of the video image or sound. BAVC defines artifact as, “an undesirable picture element in a video image, which may naturally occur in the recording process and must be eliminated in order to achieve a high quality image. Most common artifacts are cross-color and cross-luminance. Not to be confused with artifact as a cultural product” (Bay Area Video Coalition, 1998).
Error refers to the underlying cause of the poor quality.
Area refers to the physical location where the error can be resolved.
Introduction
As described in the A/V Artifact Atlas:
For original archival audio or video materials, the recorded signal must be reformatted in order to remain accessible. During the playback and reformatting process, how can we determine if an error we see or hear is inherent to the original recording, or was the result of an imperfect transfer? How can we tell if it is a sign of equipment malfunction or media damage? How do we know if it can be remedied?
Identification and definition of audio-visual artifacts is a critical part of archival work. Any number of errors in the signal encoding, or re-encoding, can occur at any point in the life cycle. Sometimes the error is introduced at the time that the recording is originally created, perhaps by either low-quality, improperly-configured or poorly-functioning equipment or by ambient conditions that interfere with the recording process. In some cases the error appears as the original recording is being reformatted, caused by damage or media deterioration that has occurred to the original media over time, or by poorly-functioning equipment used in the reformatting process. At any time, operator error can result in unintentional mistakes that reduce the quality of the transfer (A/V Artifact Atlas, 23 February 2015).
Categorization: The categories used in this manual are meant to make solving a problem more efficient and intuitive. They refer to the physical location where adjustments may be made to improve the video quality. Without this direction, guess work can lead to additional errors if multiple adjustments are made in several areas. Below is a list of artifacts that may occur during digitizing. They are broken down into categories based upon area:
1. TBC Errors: The levels on the TBC are out of ideal range and require adjustment to fit the needs of the tape.
2. Mechanical Errors: There is something wrong with the player and its interaction with the tape; cleaning or adjustment of the player is required.
3. Tape Damage: The tape is damaged from wear/age/use etc.
Within each of these areas, several common errors may occur during processing creating the artifact. The following list outlines the way the rest of this manual is organized to help you identify and fix the errors you may encounter. Each error is broken down to explain what you will see and what it means. Step-by-step instructions are provided where possible to assist you in identifying, confirming and, if possible, solving specific errors. With older, deteriorating tapes, some problems may occur which are unavoidable. The graphs and playback filters will help you to determine whether or not this is the case.
TBC Errors
-
High Video Level
-
Undersaturation
-
Oversaturation
-
Chrominance Noise
-
Luminance Noise
-
Hue
-
Y/C Delay Error
-
TBC Processing Artifact
Mechanical errors
-
Tracking Error
-
Skew Error
-
Video Head Clog
-
Head Switching Noise
-
Timecode Error
Tape Damage
-
Dropout
-
Tape Crease
Alternative Categories: The A/V Artifact Atlas organizes errors within their index in a slightly different manner. The error categories are defined by the root of the problem: Device Error, Operator Error, Production Error, and Tape Error. While these categories are scientifically accurate and incredibly helpful if you are familiar with video terms, the gray areas between them can be a bit overwhelming. The categories in this manual are tailored to apply to your institution’s needs and digitizing workstation.
Production Error is the only category without an equivalent in this manual. The majority of production errors require initial trouble shooting to determine whether or not production is actually the cause. By weeding out an alternative error (device, operator, or tape), a production error will become apparent. In cases where it is impossible to remove an artifact from the video image, it is most likely caused by age or production. It is very difficult to know for certain whether or not the artifact was created in production or through other means, so trying your best to fix it and then moving on is the most efficient and functional work plan. For any case where a production error may be present, the possibility has been noted.
Please note there are many more errors that can compromise video quality than are described here. For more information, visit the A/V Artifact Atlas (http://avaa.bavc.org/artifactatlas/index.php/A/V_Artifact_Atlas).
TBC Problems
The bullet points under each item are formatted to explain how to spot this error during play back, how to confirm this using QCTools, know whether or not it can be solved by adjustments/re-digitizing and, if so, how to solve it.
-
High Video Level
-
Undersaturation
-
Oversaturation
-
Chrominance Noise
-
Luminance Noise
-
Hue
-
Y/C Delay Error
-
TBC Processing Artifact
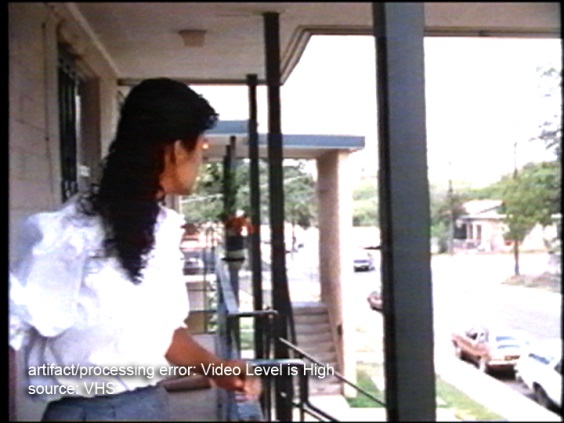
1. High Video Level (Video Gain Error)
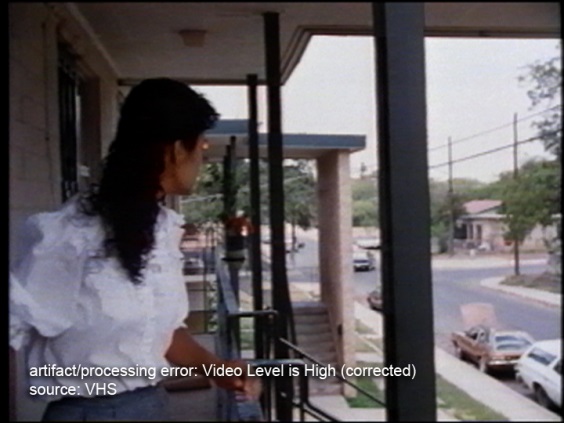
What You See During Playback Areas with a lot of light or white (notice the sky and the shirt in the image below) will appear washed out or overly bright and detail will be lost.
When a video signal is recorded, peak white levels can usually be adjusted in a camera, a playback VTR or a number of intervening processing amplifiers. In some cases, natural tips of the video level can be overdriven by miscalibration and become clipped at the top of the video signal. Particularly bright scenes might have natural peaks above 100 IRE in raw camera footage, but clipped video signals above that range may mean detail in the video image is being lost during digitization. Video levels that are too high can also introduce noise into the image that is not in the original source.
Before After
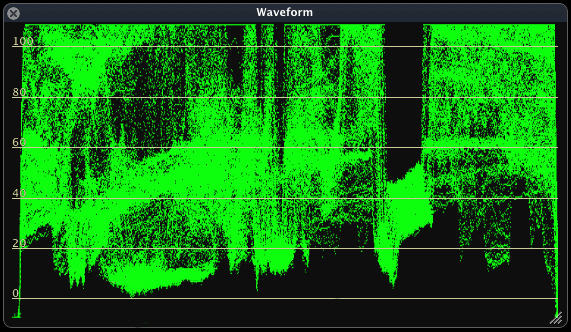
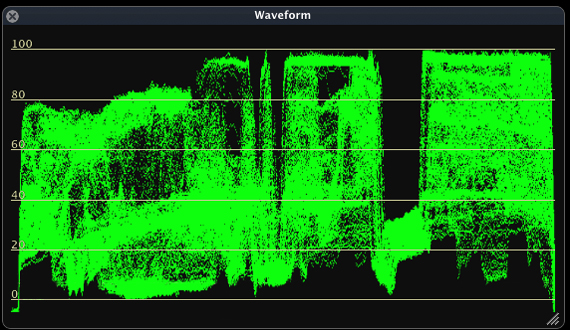
What You See on BlackMagic Design – Check the Luma and Black activity by looking at the Waveform monitor on the BlackMagic Design display. If the waves are consistently above the 100-110 mark and crushed/flat, this could indicate that the video signals are out of range.
Before After
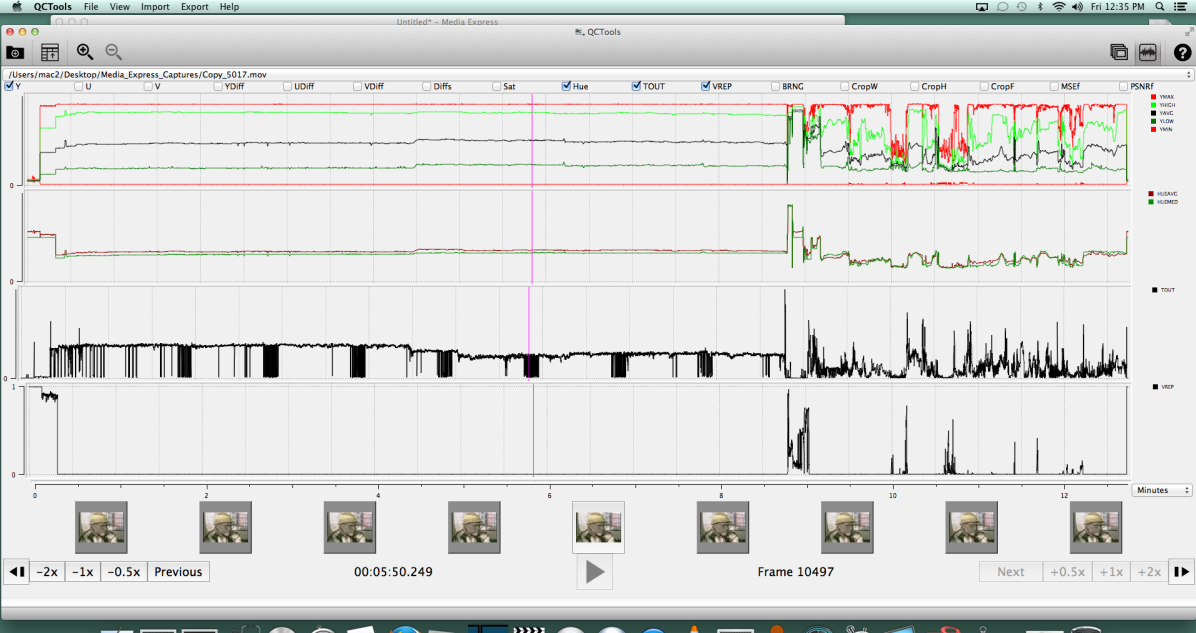
How to Check in QCTools (Graph) - To confirm that this is the cause of the problem, run through QCTools. Click on the check box to display the Y graph. Locate the point in the recording containing the artifact by using the time signature guides on the bottom. Note the IRE levels of the Y AVG (average) line within the Y graph by using the guides on the left side of the graph. The lines should be around 128. If there are dramatic peaks in the graph above 110 that last for more than a few frames, high video level is most likely the cause. Occasional peaks can be created by a brief burst of light or a white fade-out.
How to Check in QCTools (Filter) Double click on the thumbnail (at the bottom of the QCTools window) that corresponds to the problematic area. The Video Analysis Window will pop-up. On the right side, select the TOUT filter and note the amount of pixels that are highlighted in yellow (out of range). Often, they will be highlighting or outlining areas of the image that are too bright.
Can You Fix It? – Yes, this is correctable through retransfer and adjustment of the VTR output using a processing amplifier to adjust video levels.
How to Fix It – The following steps will allow you to adjust the video level and troubleshoot fixing the image quality:
-
Start playback in Black Magic and begin capturing.
-
On the TBC that corresponds with the Mac you are using, check that the display panel is in showing the idle screen (displaying the Y, C, and R bars).
-
Click Enter to access the Main menu.
-
Click Enter to select the Video Setup menu.
-
Click Enter to select Video Gain. Once this control opens, it will display a bar range with 0 at the middle. This is usually the current/automatic setting, unless someone had adjusted it prior to your digitization. If the display does not open at 0, the cause could be that previous adjustments do not work with your current tape. Set the video gain back to 0 and see if that resolves the problem. If the display opens at 0, then make adjustments while viewing the playback to see if this fixes the image. Note the level of the video gain. If changes do occur, end the capture and run it through QCTools (same graphs and filters).
-
Note the changes in the graph as the adjustments occurred. If they are still out of range, notice the amount of the video gain adjustment (TBC display) vs. the changes in the graph. Using this rough estimation, try the quick capture again, making adjustments to try to reach ideal range. Do this as many times as necessary to achieve the best image quality possible.
-
Make sure all the other levels are still ideal and digitize the tape.
2. UnderSaturation
What Do You See During Playback The video signal is undersaturated when chrominance amplitude is restricted to values under reference standard level (i.e., 75% SMPTE color bars), causing colors to appear washed out and unnaturally pale. Undersaturation can be difficult to identify because video is sometimes intentionally given a desaturated “look” during post-production treatment or finishing. However, raw camera footage should always be appropriately saturated and calibrated to reference color bars, if available, unless otherwise stated in production notes.
NOTE: If the video was previously transferred from film, color fade from the original film may be present. A fading of the cyan and yellow dyes resulting in an oversaturation of magenta is the most common manifestation of this problem.
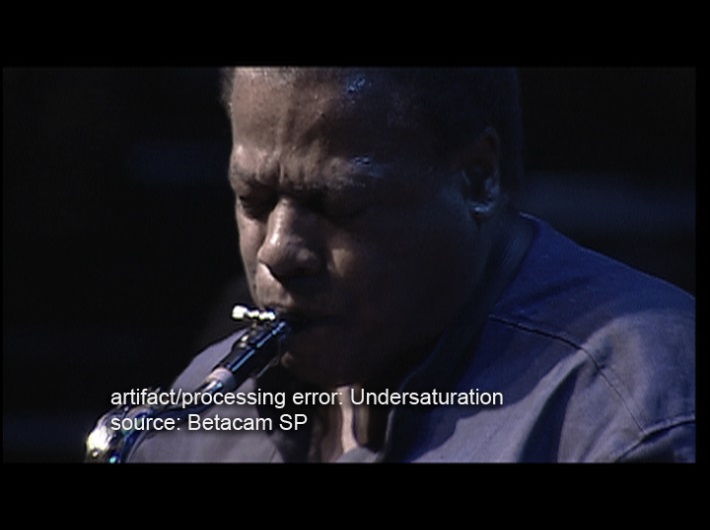
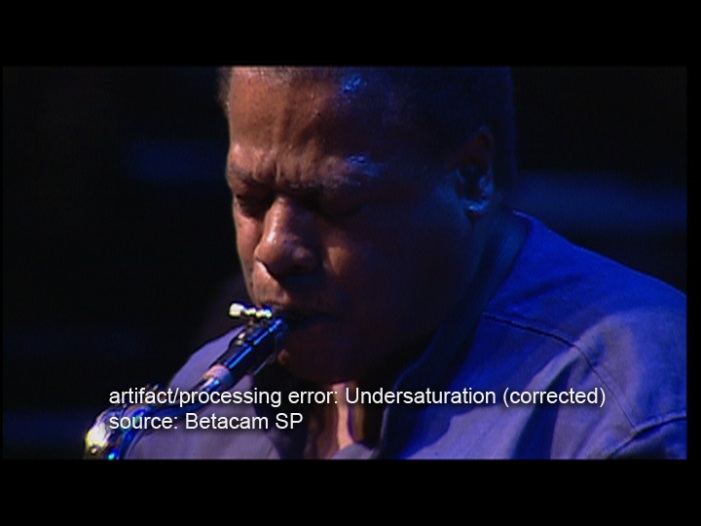
Before After
First Check Before making adjustments, check to make sure this is not a Field error (see Mechanical Problems, 3. Video Head Clog, Additional)
How to Check in QCTools (Graph) Select the Sat and Hue. Hue AVG should be at 147 and Sat should be at or below 88.7 and above 0. Select the V and U graphs. The lines should all be relatively smooth (straight/flat) and should be between 0-88.7. Undersaturated images will be way below 88.7. The Hue may also be too high or low (above or below 147).
Can You Fix It? Yes, this is correctable through adjustment of the Chroma and Hue levels.
How to Fix It – The following steps will allow you to adjust the video level and troubleshoot fixing the image quality:
-
Start playback in Black Magic and begin capturing.
-
Click Chroma on the TBC. Once this control opens, it will display a bar range with the IRE enlarged.
-
While watching the Vectorscope on the BlackMagic Design display, slowly rotate the dial on the TBC to the right to increase.
-
Note the level of Chroma gain. If changes do occur, end the capture and run it through QCTools
-
Note the changes in the graph as the adjustments occurred. If they are still out of range, notice the amount of the Chroma adjustment (TBC display) vs. the changes in the graph. Using this rough estimation, try the quick capture again, making adjustments to try to reach ideal range. Do this as many times as necessary to achieve the best image quality possible.
-
If the Hue AVG was not at 147, it also needs to be adjusted. Click Hue on the TBC. Once this control opens, it will display a bar range with the IRE enlarged.
-
While watching the Vectorscope on the BlackMagic Design display, slowly rotate the dial on the TBC to the right to increase or left to decrease (depend on what its previous graph reading was).
-
Note the level of Hue gain on the TBC display. If changes do occur, end the capture and run it through QCTools
-
Note the changes in the graph as the adjustments occurred. If the end results are still out of range, notice the amount of the Hue adjustment (TBC display) vs. the changes in the graph. Using this rough estimation, try the quick capture again, making adjustments to try to reach ideal range. Do this as many times as necessary to achieve the best image quality possible.
-
Make sure all the other levels are still ideal and digitize the tape.
3. OverSaturation (Chroma Error)
What Do You See During Playback Oversaturation refers to high chrominance amplitude in a video signal, creating the appearance of very intense color in the image. Depending on severity of oversaturation, color in the image may appear to bleed into areas outside of an object’s apparent boundaries. Most NTSC broadcast standards require that the composite video signal not exceed 120 IRE (flat). SMPTE split Field color bars use 75% Saturation as the maximum value for calibration, although there are other patterns used for testing which contain 100% Saturation values.
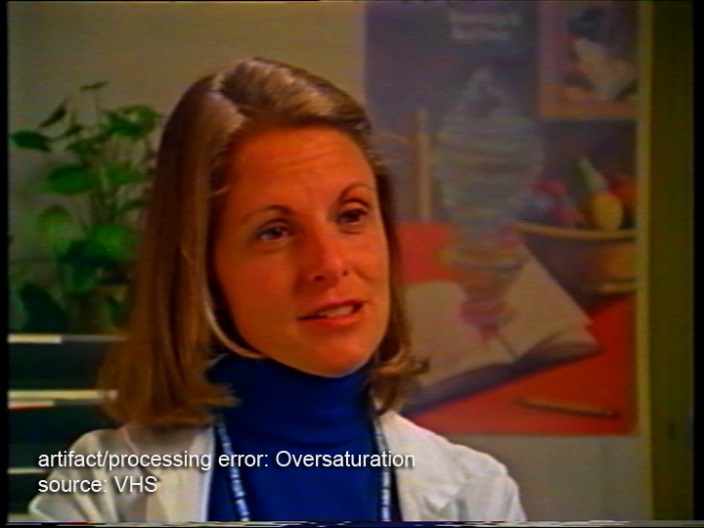
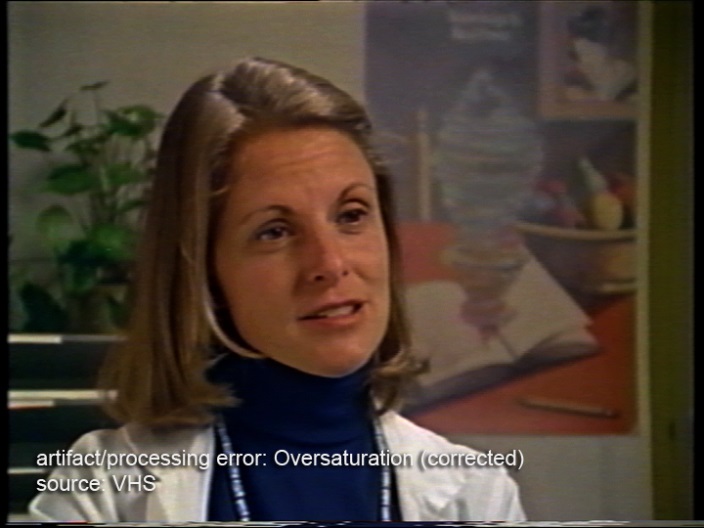
Before After
What You See on BlackMagic Design the trace within the Vectorscope will be extending beyond the color markers (the small squares by the letters).
How to Check in QCTools (Graph) Select the Sat and Hue. Hue AVG should be at 147 and Sat should be at or below 88.7. Select the V and U graphs. The lines should all be relatively smooth (straight/flat) and should be between 100- 120. Oversaturated images will be way above 120. The Hue may also be too high or low.
Can You Fix It? Yes, oversaturation is correctable through retransfer and adjustment of the VTR output using the TBC controls.
How to Fix It – The following steps will allow you to adjust the video level and troubleshoot fixing the image quality:
-
Start playback in Black Magic Media Express and begin capturing.
-
Click Chroma on the TBC. Once this control opens, it will display a bar range with the IRE enlarged.
-
While watching the Vectorscope on the BlackMagic Design display, slowly rotate the dial on the TBC to the left to lower.
-
Note the level of Chroma gain. If changes do occur, end the capture and run it through QCTools
-
Note the changes in the graph as the adjustments occurred. If they are still out of range, notice the amount of the Chroma adjustment (TBC display) vs. the changes in the graph. Using this rough estimation, try the quick capture again, making adjustments to try to reach ideal range. Do this as many times as necessary to achieve the best image quality possible.
-
If the Hue AVG was not at 147, it also needs to be adjusted. Click Hue on the TBC. Once this control opens, it will display a bar range with the IRE enlarged.
-
While watching the Vectorscope on the BlackMagic Design display, slowly rotate the dial on the TBC to the right to increase or left to decrease (depend on what its previous graph reading was).
-
Note the level of Hue gain on the TBC display. If changes do occur, end the capture and run it through QCTools
-
Note the changes in the graph as the adjustments occurred. If the end results are still out of range, notice the amount of the Hue adjustment (TBC display) vs. the changes in the graph. Using this rough estimation, try the quick capture again, making adjustments to try to reach ideal range. Do this as many times as necessary to achieve the best image quality possible.
-
Make sure all the other levels are still ideal and digitize the tape.
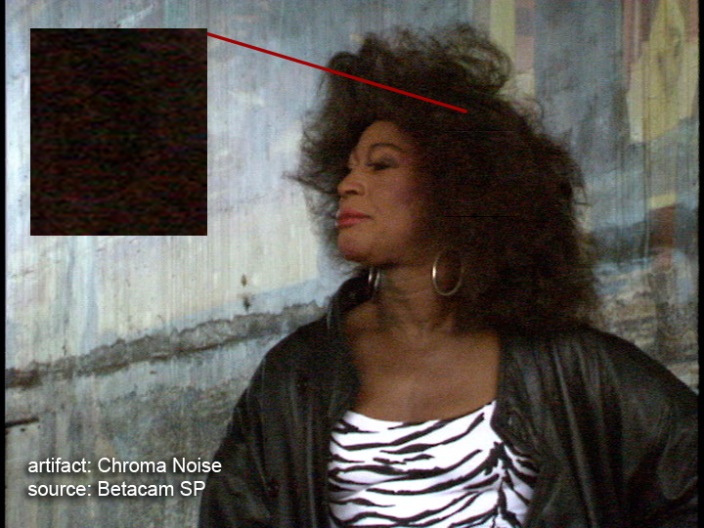
4. Chrominance Noise
What Do You See During Playback – Chrominance noise can be identified as traces and specks of color in an otherwise clear picture. It is most visible in dark, saturated areas of the video image. It can be due to limitations of CCD sensitivity in video cameras (i.e., low-lighting conditions during camera recording), over-boosting of chrominance in the video signal, or the use of poor video processors. Multi-generation composite dubs may suffer from high levels of chrominance noise.
What You See on BlackMagic Design On the Vectorscope, the specks of trace with appear to bounce or reverberate outward from the concentration of trace at the center. This movement is similar that of ripples, but happen in odd bursts, There may also be a constant presence of speckled trace that extend out much further than the concentration of trace pattern.
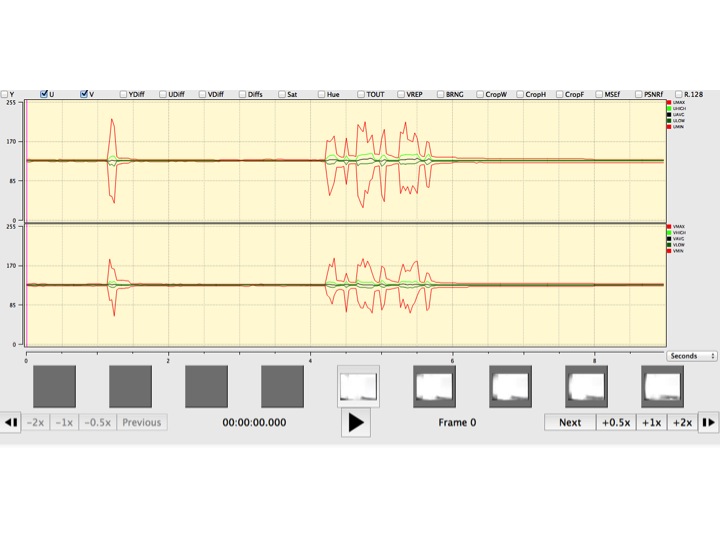
How to Check in QCTools (Graph) Select the U and V graphs. Look for any areas with abrupt spikes or plummets (particularly in the MIN and MAX).
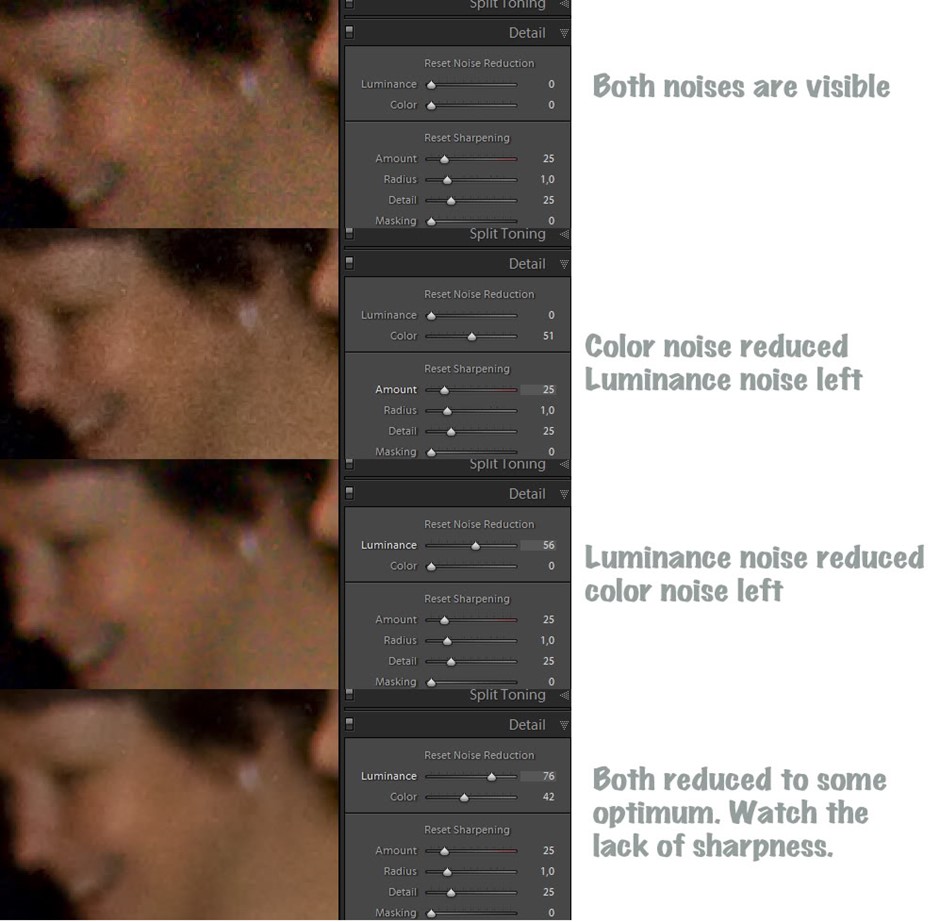
How to Check in QCTools (Filter) double-click a frame with Chroma noise (corresponding to the same time signature as a spike in the graph) and select the Histogram filter in the right hand view. Check the U and V boxes to view just these two graphs. If the plots are climb the edges of the display or do not extend to both edges, the Chroma levels are most likely off.
Can You Fix It? Maybe. If the video output has been properly adjusted for playback, there is not an acceptable fix for this problem in preservation workflows.
How to Fix It If the Chroma levels (U and V) were off, you can try the following steps to reduce the noise:
-
Start playback in BlackMagic Media Express and begin capturing.
-
Click Chroma on the TBC. Once this control opens, it will display a bar range with the IRE enlarged.
-
While watching the Vectorscope on the BlackMagic Design display, slowly rotate the dial on the TBC to the left to lower.
-
Note the level of Chroma gain. If changes do occur, end the capture and run it through QCTools
-
Note the changes in the graph as the adjustments occurred. If they are still out of range, notice the amount of the Chroma adjustment (TBC display) vs. the changes in the graph. Using this rough estimation, try the quick capture again, making adjustments to try to reach ideal range. Do this as many times as necessary to achieve the best image quality possible.
5. Luminance Noise
What Do You See During Playback Luminance noise is noise where only the brightness of a colored pixels is affected (but the color as such is fine). This appears as a bright layer of white noise (a translucent layer of snow) over the image.
What You See on BlackMagic Design The Waveform monitor will show an uneven trace spread, with trace that is consistently out of ideal range.
How to Check in QCTools (Graph) On the Y graph, look for any plots that are not within the 16-235 range or where the peaks and valley are noticeably erratic. On the YUV Diffs graph, see if there is a significant different between the Y plot and the U/V plots. Also, look at the Broadcast Range graph; normal, noise-free video would not trigger this filer, but noise occurring outside of these parameters would read as spikes in the graph. Typically anything with a value over 0.01 will read as an artifact.
How to Check in QCTools (Filter) Double click on a frame that contains Luma noise. On the right hand view, compare the Broadcast Range Pixels filter with the TOUT filter. Both will possibly present spots (specks) highlighted in yellow. Notice the spread of the yellow specks in both. Do they outline areas that are either white or black? Or are they evenly spread across the image? If the spread is even, the noise is probably caused by tape damage. If it is concentrated in certain areas, this is most likely a Luma level artifact that is can be fixed through adjustment or was recorded into the original image.
Can You Fix It?Maybe. If the video output has been properly adjusted for playback, there is not an acceptable fix for this problem in preservation workflows.
How to Fix It If the Luma levels (Y) were off, you can try the following steps to reduce the noise:
-
Start playback in BlackMagic Media Express and begin capturing.
-
Click Luma on the TBC. Once this control opens, it will display a bar range with the IRE enlarged.
-
While watching the Vectorscope on the BlackMagic Design display, slowly rotate the dial on the TBC to the left to lower.
-
Note the level of Luma gain. If changes do occur, end the capture and run it through QCTools
-
Note the changes in the graph as the adjustments occurred. If they are still out of range, notice the amount of the Luma adjustment (TBC display) vs. the changes in the graph. Using this rough estimation, try the quick capture again, making adjustments to try to reach ideal range. Do this as many times as necessary to achieve the best image quality possible.
6. Hue
What Do You See During Playback The colors will immediately appear “off” and most noticeably, the majority of featured skin tones will look unnatural (too orange, red, yellow, etc.)
What You See on BlackMagic/Vrecord Design on the Vectorscope the concentration of trace will not point exactly at the 147⁰ point (skintone line marked on Vrecord vectorscope) and the color concentration will be significantly uneven. The Hue measurement on the Vrecord numerical display will be significantly above or below 147⁰.
Please note: Hue can be very tricky. The numbers above for the suggested range are based on an image that is mostly of a person’s face/skin (all/any skin colors). Having other objects in a variety of colors will affect the reading. For example, if a person is wearing red, the hue average will be much higher (closer to 147⁰-150⁰) or if he/she is standing next to a bunch of trees on a bright day, the hue average will be much lower (closer to 110⁰-125⁰). Both of these colors can reflect onto the person’s and cause his/her skin to appear pink or yellow/green, even when the hue is in balance. This is most problematic with Umatic video.
How to Check in QCTools (Graph) The Hue measurement on the will be significantly above or below 147⁰.
How to Check in QCTools (Filter) Hue, Saturation, Diffs, & U/V
Can You Fix It? Yes (most likely)
How to Fix It Using the TBC that corresponds with the Mac you are using, do the following:
-
Push the Hue button
-
Using the dial, adjust the range to be 147⁰. Adjusting the Hue on the TBC will rotate the angle of the pattern (trace) on the Vectorscope.
-
Check your work by watching the Vectorscope monitor on the BlackMagic Design display. The angle of Hue should be about 123-147⁰ or about 11 o’clock. In Vrecord, the program window Vectorscope has markers for the skintone line
-
For more information read the Vectorscope section in the Video Processing Manual.
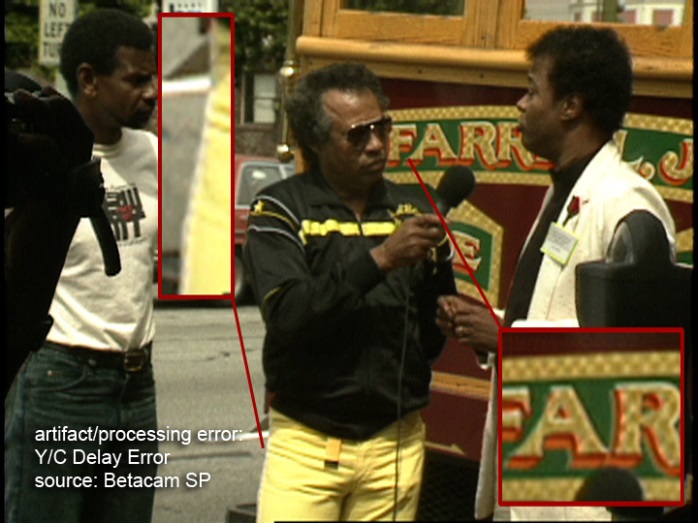
7. Y/C Delay Error
What Do You See During Playback When video suffers from Y/C delay error, there will be a mismatch in the timing among the luminance and/or color channels, with resulting visible misalignment in how colors appear in the monitor. A misalignment of Y/C shows a blurry edge around areas with high contrast color difference, and will be most apparent around sharp edges of objects in the video image. Notice the difference in the images below highlighted in the enlarged detail boxes. In the Before (image on the left) you can see a white edge along the reporter’s yellow jeans, as well as a green hue around the orange drop shadow in the lettering on the sign behind them. This is caused by misaligned Y and C components in the video signal. The error is corrected in the After image (image on the right).
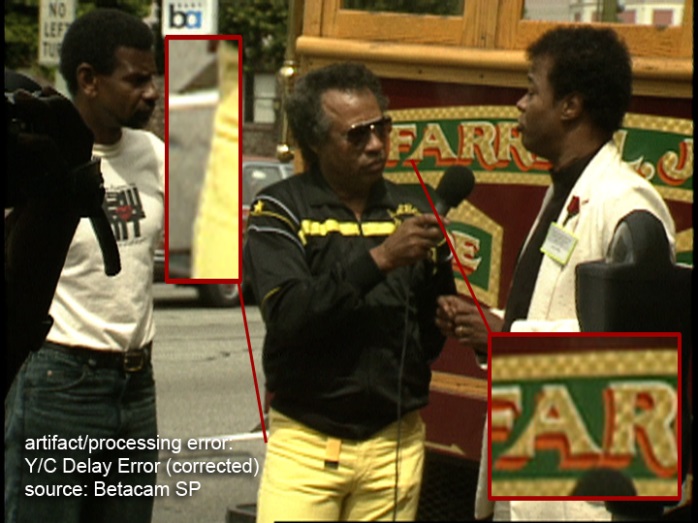
Before After
What You See on BlackMagic Design
How to Check in QCTools (Filter)
Can You Fix It? Yes, some time base correctors (VTR integrated or stand-alone) have Y/C adjustment capability.
How to Fix It – The following steps will allow you to adjust the video level and troubleshoot fixing the image quality:
-
Start playback in Black Magic and begin capturing.
-
On the TBC that corresponds with the Mac you are using, check that the display panel is in showing the idle screen (displaying the Y, C, and R bars).
-
Click Enter to access the Main menu.
-
Click Enter to select the Video Setup menu. Use the knob to scroll through the list of options.
-
Click Enter to select Input Y/C Delay. Once this control opens, it will display a bar range. Make adjustments while viewing the playback to see if this fixes the image. Note the level of the video gain. If changes do occur, end the capture and run it through QCTools (same graphs and filters).
-
Note the changes in the graph as the adjustments occurred. If they are still out of range, notice the amount of the input Y/C delay adjustment (TBC display) vs. the changes in the graph. Using this rough estimation, try the quick capture again, making adjustments to try to reach ideal range. Do this as many times as necessary to achieve the best image quality possible.
-
Make sure all the other levels are still ideal and digitize the tape.
8. TBC Processing Artifact
What Do You See During Playback An artifact which is generated by maladjustment or circuitry failure in an integrated or stand-alone time base corrector (TBC) can be categorized as a processing artifact. Depending on the type of TBC used, these have a diverse set of manifestations and can include over-enhancement and aggressive noise reduction. If a video signal output to a time base corrector is suddenly lost due to low RF from severe media damage, a head clog or some other incident, the TBC may output noise while the processor attempts to re-lock to the incoming video signal.
In the example below, a TBC was introducing errors through overcorrection. The image on the left is the correct image processed through a properly functioning TBC, while the image on the right shows overcorrection for what would otherwise be minimal skewing at the top, and a line error now appearing along the bottom. During playback, this tape showed a vertically shaky display that wasn’t occurring before the signal was sent through the TBC.
Correct Incorrect
What You See on BlackMagic Design
How to Check in QCTools (Graph)
How to Check in QCTools (Filter)
Can You Fix It? This artifact may be correctable by readjustment or calibration of the TBC. If the TBC cannot process video output due to poor playback signal from the VTR, the media must be treated to improve playback or a different and more effective TBC must be used.
How to Fix It
 Mechanical Problems
The bullet points under each item are formatted to explain how to spot this error during play back, how to confirm this using QCTools, know whether or not it can be solved by adjustments/re-digitizing and, if so, how to solve it.
-
Tracking Error
-
Skew Error
-
Video Head Clog
-
Head Switching Noise
-
Timecode Error
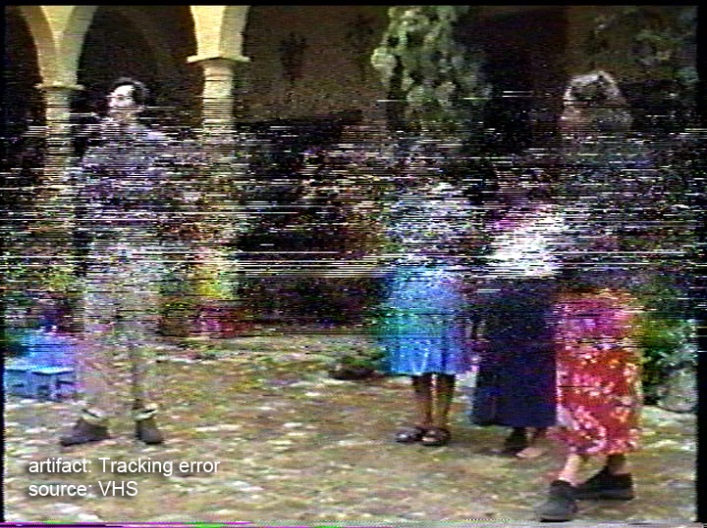 1. Tracking Error
What Do You See During Playback Tracking error is visible as a distortion produced during playback caused by the inability of video heads to correctly follow the video tracks recorded on a tape. The tracking control adjustment corrects for this error. It delays the control track signal during playback so its position approximates the position of the control track head that was used on the recording machine.
What You See on BlackMagic Design See Waveform filter (same as BlackMagic Design display) below.
How to Check in QCTools (Graph) Large tracking errors in a video file will be clearly evident as significant spikes in the Temporal Outliers (TOUT) graph. Check the boxes to generate graphs for both TOUT and VREP. Examples of TOUT graph and playback images with tracking errors below.
How to Check in QCTools (Filter) Double click on the thumbnail (at the bottom of the QCTools window) that corresponds to the problematic area. The Video Analysis Window will pop-up. On the right side, select the Temporal Outlier Pixels filter. This is the same presentation as Normal except that pixels that are labelled as temporal outliers are highlighted in yellow. Temporal outliers are pixels that significantly differ from their neighbors and often correspond to tape damage or playback error. A certain level of this is so be expected, especially on older tapes, but the lines of the TOUT graph should remain between 0-0.009 and be closer to 0 for the majority of the playback.

The yellow highlighted pixels should also be evenly scattered and not too concentrated in one or more spot (see example above). Note any significant increases in the pixels, corresponding to the distortion on the Normal playback and spikes in the TOUT graph (see image below).
In the above image, the pixels are concentrated in places where the white or black levels are out of range (overly dark or overly bright/white). This would signify a TBC adjustment error, whereas the first image implies either damage to the tape or a tracking error. Also, often times with a tracking error, if you leave the Temporal Outlier Pixels filter up during playback, the yellow areas with move change significantly and quickly.
Next, select the Vertical Line Repetitions filter. This will help to separate damage or tracking errors from color errors.
Can You Fix It? Yes, a tracking error can be corrected by careful tracking adjustment. Severe tracking errors with a particular piece of media may require a custom tape path alignment.
How to Fix It On the front of the U-matic player, just to the right of the Audio Level knobs, is the Tracking knob. While in playback mode, slowly twist the knob back and forth and notice if the problem increases or decreases. Make sure to try going all the way to the left and to the right, as well as going very slowly to see if, at any point the distortion dissipates. If not, this may be a tracking error that would require a custom tape path alignment or might imply damage to the tape.
2. Skew Error
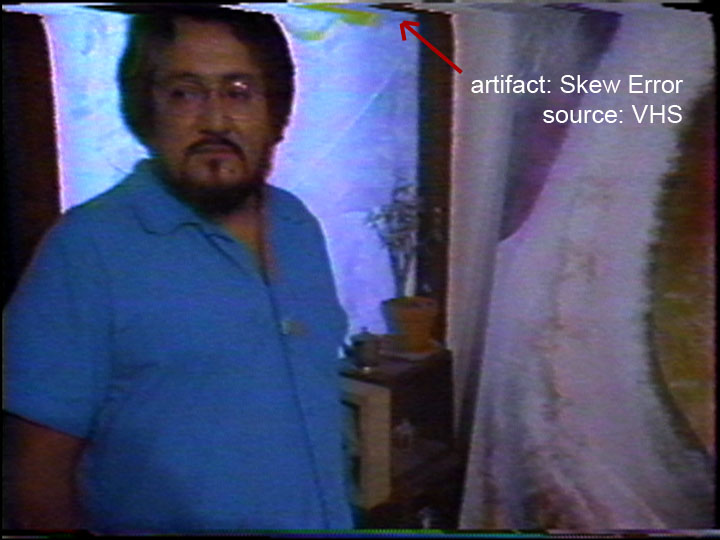 What Do You See During Playback Tape
is susceptible to expansion and shrinkage, see Lengthwise Tape Expansion
or Shrinkage These dimensional changes impact the length and angle of
the recorded tracks. On playback, the loss of correspondence between the
track position and the playback head results in a skewed picture. “A
skew error shows as a hooking in the picture at the top [or bottom] of
the TV monitor. If the picture hooks to the left, the video track on the
tape is longer than the playback track length of the machine. If the
picture hooks to the right, the video track on the tape is shorter than
the playback length of the machine”. Audio may also be affected. “Even
if there is no actual image error, it is possible to see, at the bottom
of the uncropped image (i.e. in underscan mode), a slight, jittery line
displacement immediately below the head switching point. If the symptom
is very pronounced, the skewing will also appear along the top edge of
the image, where it becomes visible as a disruptive skew error.”
What Do You See During Playback Tape
is susceptible to expansion and shrinkage, see Lengthwise Tape Expansion
or Shrinkage These dimensional changes impact the length and angle of
the recorded tracks. On playback, the loss of correspondence between the
track position and the playback head results in a skewed picture. “A
skew error shows as a hooking in the picture at the top [or bottom] of
the TV monitor. If the picture hooks to the left, the video track on the
tape is longer than the playback track length of the machine. If the
picture hooks to the right, the video track on the tape is shorter than
the playback length of the machine”. Audio may also be affected. “Even
if there is no actual image error, it is possible to see, at the bottom
of the uncropped image (i.e. in underscan mode), a slight, jittery line
displacement immediately below the head switching point. If the symptom
is very pronounced, the skewing will also appear along the top edge of
the image, where it becomes visible as a disruptive skew error.”
Can You Fix It? Maybe. Some VTRs have skew controls that allow for minor adjustments in tape tension, most notably, several models of U-matic machines and some 1/2” open reel models. Otherwise, skew error may be minimized through the use of a good time base corrector (TBC). It may also require an alignment adjustment or back tension adjustment in the player equipment, but be careful: this kind of tinkering should be done by a trained technician and not performed on equipment used for recording.
How to Fix It The U-matic players have a horizontal Skew switch to the right of the analog time counter. While the video is in playback, slowly move the switch from side to side and notice if the edges of the frame bend or straighten. Not all bends can be fixed this way, but they can be made less noticeable. When bending (or hooking) is present, this is also the quickest test. As with tracking, you may not be able to completely fix this error.
3. Video Head Clog
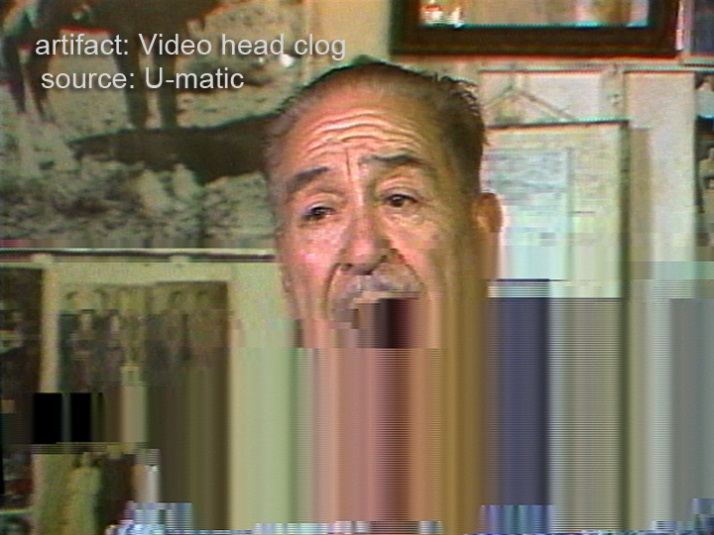 What Do You See During Playback When
loose oxide builds up in the tape path, it can travel with the tape to
the drum assembly and prevent the video head from making contact with
the tape. The result is a heavily obscured image or a complete loss of
image. A video head clog requires thorough cleaning of the video heads
if the clog obstructs RF completely during playback. In most cases, a
severe head clog cannot be removed by playing a cleaning tape through
the VTR. The head and drum assembly must be manually cleaned using a
cleaning solution.
What Do You See During Playback When
loose oxide builds up in the tape path, it can travel with the tape to
the drum assembly and prevent the video head from making contact with
the tape. The result is a heavily obscured image or a complete loss of
image. A video head clog requires thorough cleaning of the video heads
if the clog obstructs RF completely during playback. In most cases, a
severe head clog cannot be removed by playing a cleaning tape through
the VTR. The head and drum assembly must be manually cleaned using a
cleaning solution.
How to Check in QCTools (Graph) Select the PSNRf and MSEf graphs (click check box) and the Diffs graph. Often, head problems with corrupted frames will result in large YUV Difference values/graph spikes. The PSNR graph will be too high and the MSE will be too low. Both graphs will be uneven.
How to Check in QCTools (Filter) Waveform
Can You Fix It? Yes.
How to Fix It Stop playback and clean the video heads on the player using an appropriate solvent and cotton swab. While you are at it, clean the tape path to prevent possible recontamination.
ADDITIONAL
To Rule Out a Head Clog Before Undersaturation – Double click on the thumbnail (at the bottom of the QCTools window) that corresponds to the problematic area. The Video Analysis Window will pop-up. On the right side, select the Normal filter for both sides. On either side, check the Field box. This will allow you to make sure that both Fields are reading the color correctly.
Since many analog video errors occur differently between the two interlaced Fields, splitting the Fields into two distinct images can make it easier to see if a given error is from problems with the analog video playback device (such as a head clog where the two Fields would react very differently) and tape damage (where the two Fields would react similarly).
The image below shows two Normal displays side-by-side where the right image has Field enabled. By viewed the Fields separated on the right, it is easily clear that while Field 1 was read correctly from the tape, there was no color data was read for Field 2.
Can You Fix It? Yes.
How to Fix It - This error can be fixed by cleaning the video player and re-digitizing the content.
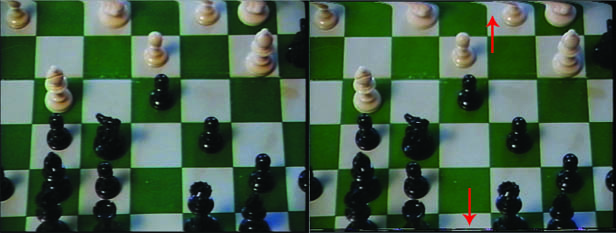
4. Head Switching Noise
What Do You See During Playback a horizontal line or section along the bottom of the frame that is consistently out of alignment from the rest of the picture. This is a result of the video heads being switched on and off and occurs as a result of the different positions that each format records information on tape.
VHS - Head switching noise is commonly seen at the bottom of video display during VHS playback. Although it occurs in other formats, it is often masked depending on the processing features and calibration of the playback VTR. During playback of videotape, video heads are turned on as they pass over the media and then turned off to prevent the display of noise that would be output when they are not in contact with the tape. Head switching noise is a result of that switching interval, and it occurs prior to the start of vertical sync. This artifact is not viewable in overscan on a broadcast monitor, but it is viewable in underscan and in full-raster digitized video and un-cropped digital derivatives. Some VTRs feature “SWP masking”, which effectively masks the lines created during head switching with video black.
Playback from a normal VHS VCR into a card that captures from line 23, showing normal switching noise.
Playback from a JVC BR-S525U into a card that captures from line 23, showing black at the bottom of the image.
Playback from a JVC BR-S525U into a card that captures from line 22, showing no switching noise. (The bending is because this card has no TBC.)
U-matic - The VO-series had the head switching point about 3-4 lines before end of active video, so you can see the head switching point at the bottom of the frame. This is also seen in VHS and Betamax. This occurs when the tape is recorded, so any tape recorded in a VO-series machine will show this problem regardless of what model machine you use for playback. The BVU-series machines placed the head switching point after the end of active video, so you do not see the problem on recordings made on BVU-series machines.
How to Check in QCTools (Graph) TOUT and VREP
How to Check in QCTools (Filter) TOUT and VREP
Can You Fix It? Yes, but only under certain circumstances. It must not have been recorded as part of the signal on the tape.
How to Fix It Adjust skew and tracking. Since the problem is one of recording and not playback, not a lot can be done to remove the artifact, but by making these adjustments, you may be able to minimize its presence.
VHS - The VHS must be played back on a VCR that advertises “switching noise masking”. There are only 8 known models that meet these criteria; all are very large “Professional” series S-VHS decks that are unable to play back tapes recorded in EP or LP modes. These are:
JVC BR -S522, -S525, -S822
Panasonic AG -DS545, -DS550, -DS555, -DS840, -DS850
JVC’s marketing explains the feature like so: “For improved playback and special-effects picture performance, a switching noise masking system is also provided. Especially effective with digitally processed special-effects pictures, this sets the switching point 1.5H lower than normal, completely eliminating on-screen switching noise.”
Even with one of these VCRs, capture devices following SMPTE RP 202’s standard for video alignment will display garbage at the very bottom of the image. To obtain a 720x480 image with no switching noise, a device that captures starting from line 22 is required. Alternatively, one that captures 720x486 can be used, allowing offending image rows to simply be cropped off.
U-matic - As previously mentioned, this artifact occurs when the tape is recorded, so any tape recorded in a VO-series machine will show this problem regardless of what model machine you use for playback. The skew control can help minimize the horizontal offset at the head switching point but it is impossible to completely eliminate the picture problem.
5. timecode Error
What Do You See During Playback Timecode error is visible as a line or section of rainbow distortion produced along the bottom or top of the picture.
Umatic - The VO-series machines do not properly support timecode. VO-series machines are not equipped with a timecode head, and do not contain the necessary filters to remove the unwanted effects where the timecode track interferes with the video. The addition of a timecode track on Umatic BVU-series machines was a big compromise. There was no empty space on the tape where to place the new track. The timecode track in BVU-series machines was placed an area that can cause “rainbow” interference at the top or bottom of the frame when played on a VO-series machine. In some cases it can cause vertical sync instability because the rainbow interference is obscuring the vertical sync of the video signal. The BVU-series machines have special filters to eliminate this interference. You should not see the rainbow interference or vertical instability on a BVU-series machine. However, a tape recorded on a BVU-series machine and played on a VO-series machine will likely show the interference. Furthermore, a tape recorded on a BVU-series machine and later copied using a VO-series machine will forever have the interference permanently on the copy.

Tape Damage
The bullet points under each item are formatted to explain how to spot this error during play back, how to confirm this using QCTools, know whether or not it can be solved by adjustments/re-digitizing and, if so, how to solve it.
-
Dropout
-
Tape Crease
1. Dropout
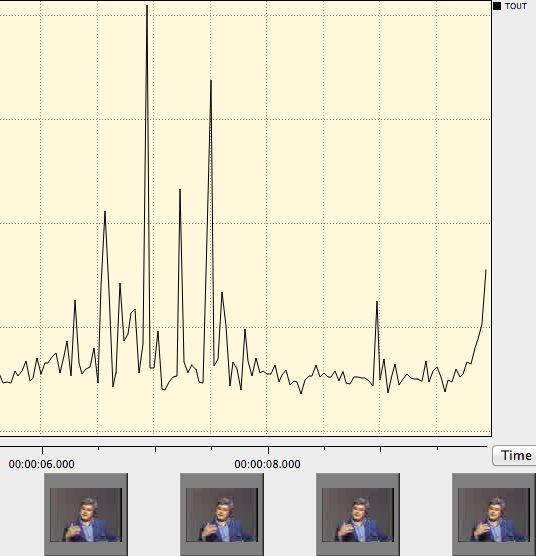
What Do You See During Playback Brief signal loss caused by a tape head clog, defect in the tape, debris, or other feature that causes an increase in the head-to-tape spacing. A dropout can also be caused by missing magnetic material. A video dropout generally appears as a white spot or streak on the video monitor. When several video dropouts occur per frame, the TV monitor will appear snowy. The frequent appearance of dropouts on playback is an indication that the tape or recorder is contaminated with debris and/or that the tape binder is deteriorating.
How to Check in QCTools (Graph) – VREP and TOUT
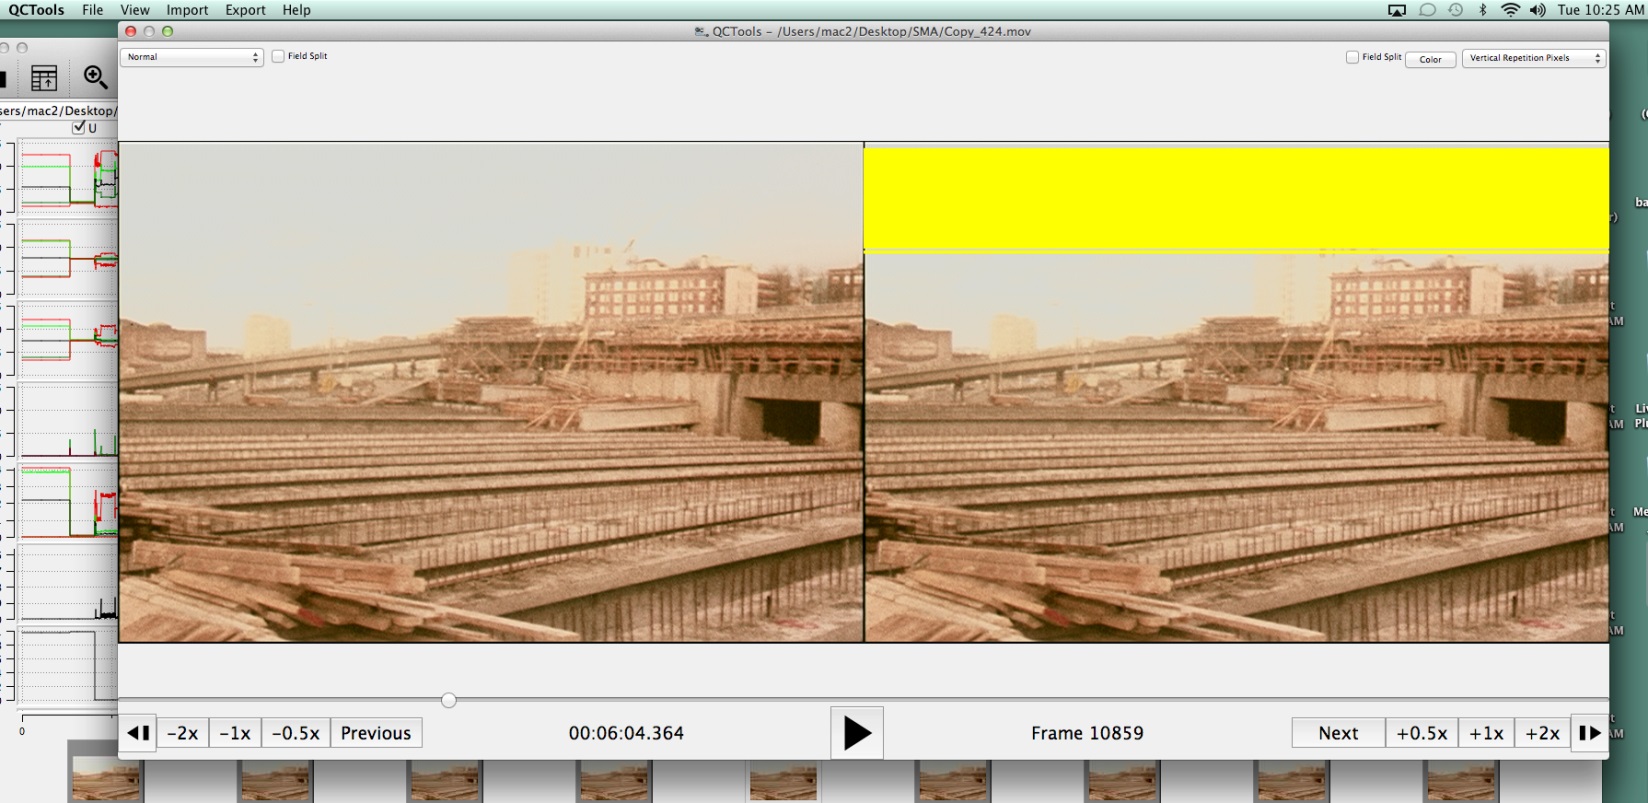 How to Check in QCTools (Filter) –
VREP
How to Check in QCTools (Filter) –
VREP
Can You Fix It?Maybe. If media is scratched so that oxide is missing, the material cannot be replaced so the dropout is permanent. Dropout may also be recorded into the original content. This can be confirmed by “stepping through” the tape in a slow playback mode.
How to Fix It Environmental dirt or loose oxide can be removed by
machine or hand-cleaning. If cleaning, it makes sense to rehouse and/or
clean the cassette shell at the same
time.
2. Tape Crease
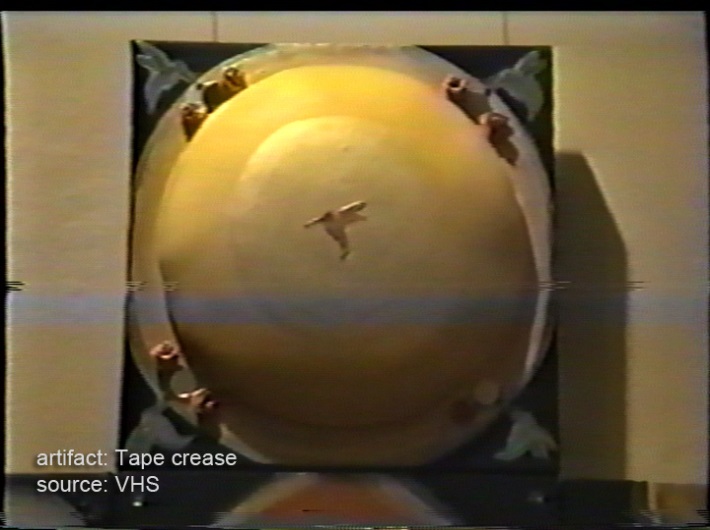 What Do You See During Playback A
tape crease is a fold or a wrinkle that can be created by a variety of
circumstances, most of which involve VTR transport problems, damaged or
misaligned tape guides, capstan/pinch roller malfunction, tape cinching,
or damage caused to media during the tape threading/unthreading process.
It results in video dropout during playback (usually horizontal and
rolling) which is due to the wrinkle in the media surface which cannot
be read entirely by the video head.
What Do You See During Playback A
tape crease is a fold or a wrinkle that can be created by a variety of
circumstances, most of which involve VTR transport problems, damaged or
misaligned tape guides, capstan/pinch roller malfunction, tape cinching,
or damage caused to media during the tape threading/unthreading process.
It results in video dropout during playback (usually horizontal and
rolling) which is due to the wrinkle in the media surface which cannot
be read entirely by the video head.
Can You Fix It?No. Tape creases are common and not easily treatable. Standard practices for safe “straightening” of videotape have not been developed.
 Glossary
This glossary has incorporated the terms used at Seattle Municipal Archives with the Preservation Glossary published by Bay Area Video Coalition with contributions from Rebecca Bachman, Pip Laurenson, Heather Weaver, Dr. John Van Bogart, and Snader & Associates Incorporated.
A
Analog recording A recording in which continuous magnetic signals are written to the tape that are representations of the voltage signals coming from the recording of the video camera or microphone. Analog signals stored on tape deteriorate with each copy or generation; in contrast see digital.
Analog-to-digital The process in which a continuous analog signal is quantized and converted to a series of binary integers.
Analog video A system of recording video images that employs continuously varying waveforms to encode brightness, color and the timing information necessary to reproduce a moving image.
ANSI See standards.
Archival format A video format that provides reliable playback, without information loss. The format should be a current (as opposed to obsolescent) professional one supported by the industry. At present archival video material is typically stored on magnetic tape however in the near future computer-based storage is likely to become an option for archives. The advantage of uncompressed digital formats over analog formats is that they can be copied without generational loss. For this reason many archives are using digital formats for creating their archival masters. Ideally these formats should be uncompressed, component formats; however, for practical and cost reasons for Suitable archival formats will change as older formats become obsolete and are no longer supported. Ideally, archival master material is transferred onto new stock every 5-7 years and at this point a decision should be made about whether it is necessary to move to a new format as well. An archival format is therefore one that can be migrated onto new stock and new formats without the loss or distortion of information.
Artifact An undesirable picture element in a video image, which may naturally occur in the recording process and must be eliminated in order to achieve a high quality image. Most common artifacts are cross-color and cross-luminance. Not to be confused with artifact as a cultural product.
B
Back coat Optional layer applied to backside of tape substrate layer, useful in reducing tape friction and distortion, as well as dissipating static charge in playback. See image.
Backing film Also called substrate. The layer that supports the magnetic layer in a magnetic tape, most commonly made of polyethylene terephthalate (PET). See image.
Baking A process of gently heating damaged videotape in an oven with controlled relative humidity in order to enable playback. As magnetic tape deteriorates the polymer of the binder deteriorates by hydrolysis, resulting in what is typically called sticky shed. Archivists have reported success in baking tapes that are suffering severe sticky shed; however, to date the scientific research has not been done to explain this. The temperature and humidity of the oven must be tightly controlled, as does the time for which a tape is baked. This process is not recommended except in extreme circumstances, as there is a suggestion that it will ultimately speed up the deterioration of the tape, although it might enable playback for remastering. There is unfortunately very little research in this area.
Bearding A type of video distortion that appears as black lines extending to the right of bright objects.
Binder The polymer used to bind magnetic particles together and adhere them to the tape substrate. See image.
Bit Shorthand for binary digit, which has two optional values “0” or “1.” Eight bits means 8 binary digits. There are 256 possible combinations for 8 binary digits and therefore color depth of 8 bits represents 256 (2x2x2x2x2x2x2x2) possible colors. Because each pixel of a video picture contains 3 samples Y’, R-Y’, B-Y’, the possible colors of an 8-bit system would be 16.7 million (256 x 256 x 256). Nowadays archives will be receiving digital material into their collections or will be generating it as part of their preservation program. It is therefore necessary that we understand digital and analog\ technology.
Bit rate The amount of data transported in a given amount of time, usually defined in Mega (Million) bits per second (Mbps). Bit rate is one way to define the amount of compression used on a video signal.
Bit error rate (BER) The percentage of bits that have errors in playback. One possible indicator for the deterioration. Playback is never perfect and there are many possible causes of error such as noise, dirt and dust, and drop out. In the binary world of digital data a bit is either correct or incorrect. Since it only has two states, the challenge is to correctly identify whether a bit is correct or not. To enable this, the data is therefore coded by adding redundant bits. All systems build in redundancy and error correction mechanisms. Information about bit error rates can refer to the bit error rate prior to error correction or the residual errors after error correction of digital videotape is an increase in the bit error rate prior to error correction.
Black, or Color Black, Blackburst A composite color video signal comprised of composite sync, reference burst and a black video signal which is usually at a level of 7.5 IRE (0.05V) above the blanking level. Also refers to fade-to-black between scenes.
Blanking level Also known as pedestal, the level of a video signal, which separates the range that contains the picture information from the range that contains the synchronizing information.
Blocking The sticking together or adhesion of successive windings in a tape pack. Blocking can result from deterioration of the binder, storage of tape reels at high temperatures, and/or excessive tape pack stresses.
Blooming The defocusing of regions of a picture where brightness is excessive. Also refers to adjusting the white levels, on video monitors, to the point of leaving gray and becoming white.
Breakup Disturbance in the picture or sound signal caused by loss of sync or by videotape damage.
Burst (or Color Burst) The reference for establishing the picture color, burst is seven to nine cycles (NTSC) or ten cycles (PAL) of subcarrier placed near the end of horizontal blanking to serve as the phase (color) reference for the modulated color subcarrier.
Burst vector composite video signals, the amplitude and angle of the color reference signal.
Byte A multi-digit binary number is called a word. A word of 8 binary digits or bits is called a byte. The amount of data that can be moved over time is expressed as MBps (Megabytes per second) or KBps (Kilobytes per second). A kilobyte of memory contains 1024 bytes, one megabyte contains 1024 kilobytes and a gigabyte contains 1024 megabytes. These concepts are essential to understanding issues relating to the storage and format choices of digital materials as well as the terminology surrounding the measurement of errors.\
C
Capstan crease Wrinkles or creases pressed into the tape by the capstan/pinch roller assembly.
Carbon black An anti-static agent added to tape binder, which also attracts debris to tape.
Chroma crawl An artifact of encoded video also known as dot crawl or cross-luminance. Occurs in the video picture around the edges of highly saturated colors as a continuous series of crawling dots and is a result of color information being confused as luminance information by the decoder circuits.
Chroma level A reference to amount of color saturation; high level Chroma that produces pastel, washed out color; low level Chroma produces heavy, saturated colors. The absence of Chroma would result in black and white.
Chroma noise A condition in which colors appear to be moving on screen. In color areas of picture, Chroma noise is usually most noticeable in highly saturated reds.
Chrominance (Chroma) The color part of a signal relating to the hue and saturation, but not to the brightness or luminance of the signal. E.g., black, gray and white have no chrominance, but any colored signal has both chrominance and luminance. U, V; Cr, Cb; I, Q: (R-Y, B-Y) represent the chrominance information of a signal.
Cinch Interlayer slippage or magnetic tape in roll form, resulting in buckling of some strands of tape. The tape will in many cases fold over itself causing permanent vertical creases in the tape. Also, if not fixed, will cause increased dropout. See windowing.
Cinching The wrinkling, or folding over, of tape on itself in a loose tape pack. Normally occurs when a loose tape pack is sped suddenly, causing outer tape layers to slip past inner layers, which in turn causes buckling of tape in the region of the slip. Results in large dropout or higher error rates.
Clipping level An electronic limit to avoid overdriving the video or audio portion of the television signal.
Cleaning Debris between the head and the surface of a tape will cause errors in playback. However, the term “cleaning” is sometimes used in a general way to refer to more than the removal of debris from the surface of a tape, but to the removal of products of deterioration and other actions of the “cleaning” machines. For example, it may be that one of the important functions of “cleaning” systems is to smooth deformations in the surface of the tape and this function could not correctly be described as cleaning but may be one of the actions being carried out by machines. These cleaning systems have a number of elements - contact with Pellon cloth, a vacuum chamber and a polishing stone. Research could valuably be conducted to establish what the effect of these cleaning systems are, what is being removed, the effect of the different elements and whether modifications could usefully be made. In addition to the systems described on the BAVC DVD Playback: Preserving Analog Video, there are also professionals who have skills and experience to hand clean videotape.
Component video An unencoded video signal in which luminance (black and white) and chrominance (color) are transmitted as separate components, as such requires greater bandwidth than composite video. Component analog video consists of three primary color signals (RGB) that together convey all necessary picture information.
Composite video A mixed encoded signal combining luminance (black and white), chrominance (color), blanking-sync NTSC, PAL, subcarrier to the luminance signal of approximately 3.58MHz in NTSC and 4.43 MHz in PAL. pulses and color burst, that includes horizontal or vertical synchronizing information, using one of the coding standards:
Compression A process employed to reduce the bit rate of digital video. Compression algorithms aim to do this in ways that minimize the visible effects. For example, most images contain large amounts of identical or similar pixels that are repeated within a frame or a sequence of frames. Intra-coded compression will identify such redundancy within each frame whereas Inter-coded compression takes into account redundancy from one picture to the next. An intra-coded compression system therefore uses a time delay to calculate the pixel differences between pictures. The first picture is an absolute picture known as an Intra-coded or “I” picture. “I” pictures are sent periodically and require a large amount of data, this is then used as the reference in order to calculate the picture differences between successive pictures known as the differentially coded picture. Essentially this form of compression takes advantage of the similarities between successive pictures sending only the differences between pictures to cut down on the amount of data transmitted. Other techniques are based on the human ability to perceive picture detail and the predictability of the signal.
Compression, lossless Coding essentially expands to provide identical data, bit compression factor of such a system is usually around 2:1. Digital Betacam is a format that employs “lossless” intra-coded compression.
Compression, lossy Coding does not expand to produce identical data to the source material and differences are detectable. MPEG 2 is an example of a lossy inter-coded compression standard. MPEG-2 is the compression system used for DVD.
Conservation The action taken to identify and assess the risks to a work of art, or artifact, from agents of deterioration, format or technology. It is part of the role of a conservator to identify and, where possible, to mitigate such risks. Where undesirable change has occurred a conservator may explore ways of intervening and treating the work of art or artifact. Decision-making is based on information about the effects of deterioration or change, an understanding of the historical and aesthetic value of that artifact and of the likely effects of any proposed action. Appropriate conservation techniques and treatments are developed in accordance with an agreed professional code of ethics. Conservators have a responsibility to future generations in preserving the historical and aesthetic value of a work. There is much debate around what constitutes “undesirable change.” For example, in the case of a video installation, debates around the parameters of acceptable change will focus on whether it is appropriate to substitute different equipment or display technologies as older formats and technologies become obsolete or difficult to maintain. Artists have an important role to play in deciding what is essential to preserve, however conservators also have a responsibility to the historical integrity of the work. Conservation decisions are complex judgements made in consultation with other relevant parties such as the artist, where possible, and the curator or historian. The professional body for conservation in the USA is the American Institute for Conservation (AIC) http://aic.stanford.edu/. In for bit, with the original source data, although the processing does introduce the possibility of errors.
A starting point for a conservator is therefore to provide a full description of the work of art or artifact being considered. Conservators are responsible for documenting changes that occur, decisions made about treatment or care and subsequent evaluation of such decisions. The relevant agents of change are dependent on the nature of the work of art or artifact being considered. Different types of artifacts will have different vulnerabilities to change and therefore different vocabularies of risk. For example, in the case of videotape we may be concerned about the impact of environmental factors such as temperature and humidity that increase the rate of deterioration or the obsolescence of a particular
The worldwide body for conservation is the International Institute of Conservation (IIC) http://www.iiconservation.org/
Conservation report A detailed description of the work of art or artifact, its condition, an analysis of the risks to that object and a description of how those risks might be mitigated. If treatment is proposed the report should document each stage of any action taken, the decision making process involved and a description and assessment of the outcome. Reports should be signed and dated.
Control track A synchronizing signal on the edge of the videotape, which provides a reference for tracking control and tape speed. Control tracks which have heavy dropout
Crease A tape deformity, which may cause horizontal or vertical lines in the playback picture. See wrinkle.
Cross-color A picture defect that appears as spurious rainbow patterns on highly textured objects, such as a striped shirt or a tweed jacket, attributed to the make-up of the NTSC signal, which mixes high luminance and chrominance composite baseband spectrum.
Crosslinking A chemical reaction of polymers. Crosslinking will lead to embrittlement when the binder is no longer flexible and the chemical makeup of the binder has changed and tightened. A reaction happens when chemicals within the binder crosslink. Mechanical action of the tape is difficult due to the tightened tape structure.
Crosstalk An undesired signal interfering with the desired signal, and usually caused by unintentional capacitive (AC) coupling. Can result in several types of picture distortion, mistracking, and/or noisy picture. Also refers to signal interference from one part of videotape to another.
Curvature error A change in track shape that results in a bowed or S-shaped track. This becomes a problem if the playback head is not able to follow the track closely enough to capture the information.
D
Data Information transmitted as binary code. In the case of component video each pixel is a vector quantity and includes information for all color components Y’, R-Y’ and B-Y.’ High quality standard definition for a moving color picture requires a data rate of 200 million bits per second.
Data Compression A technique that provides for the transmission or storage, without noticeable information loss, of fewer data bits than were originally used when the data was created.
Decoder A device used to recover the component signals from a composite (encoded) source. Decoders are used in displays and in various processing hardware where component signals are required from a composite source, such as composite Chroma keying of color correction equipment, etc.
Deterioration The degradation of videotape, most typically with the binder, which is responsible for holding the magnetic particles on the tape and facilitating tape transport. If the binder loses integrity - through softening, embrittlement, loss of cohesiveness, or loss of lubrication - the tape may become unplayable. Sticky tape and sticky shed are commonly used terms to describe the phenomenon associated with deterioration of the magnetic tape binder. See image.
Digital bits generation (ones and zeros) Unlike analog, there is no information loss with each copy.
Drop-frame time code SMPTE time code format that continuously counts 30 frames per second but drops 2 frames from the count every minute except for every tenth minute (drops 108 frames every hour) to maintain synchronization of information in the same or which are improperly recorded may cause tracking errors or picture jumps. Electronic system that functions by converting the time code with clock time. This is necessary because the actual frame rate of NTSC video is 29.94 frames per second rather than 30 frames.
Dropout Momentary signal loss of video or audio during playback on a tape machine, and caused by momentary loss of tape contact with the playback head, tape head clog, flaws in the tape or other features that cause an increase in the head-to-tape spacing. Dropout can also be cause by missing magnetic material. Video dropout generally appears as a white spot or streak on the video monitor. When several video dropouts occur per frame, the TV monitor will appear snowy. The frequent appearance of dropout on playback is an indication that the tape or recorder is contaminated with debris and /or that tape binder is deteriorating.
Dub a copy of a video recording, or to make a copy.
Dubmaster The copy of a master used for making additional copies.
DVD Abbreviation for Digital Versatile Disc. There are a number of different types of DVD. At the time of writing these include DVD-R, DVD-Rom, DVD-RAM, DVD+RW, DVD-R/W. DVD is not a suitable archival format for video mainly because it uses a lossy form of compression - MPEG2. It is also a format that is likely to see rapid changes in technology and therefore the risk of speedy obsolescence is high. DVDs are made up of a reflective aluminum layer, a polycarbonate substrate, a dye layer and a clear lacquer. The aluminum layer is highly susceptible to pollution and the lacquer layer does not sufficiently protect the aluminum layer to prevent oxidation. Where the DVD is double-sided the two sides are bonded using an adhesive. The adhesive have not been subjected to accelerated aging tests by the manufacturers and there is little data on their life expectancy. A DVD is the same diameter as a CD (120cm) but cannot be read by the same equipment. DVD and CD both record data by encoding it as tiny pits in tracks that correspond to the zeros and ones of binary digits. The pits are read by laser and played back. DVD is able to store more data by making the pits smaller and the tracks closer together and employing the compression system MPEG II. Many artists use DVD-R as an exhibition format and this has replaced laser disc as a popular display format for many museums and galleries. However, because of the way the data is encoded frame-accurate control cannot be achieved by referencing the picture content as it can with laser disc. Where external control is needed for display it is important to be clear of any specific requirements of the control system before having the disc(s) made.
DVD-R discs were introduced in 1997 with the capacity of 3.95 GB and a track pitch of 0.8 microns that later, by reducing the track pitch to 0.74 microns, this was increased to 4.7GB.
There are two types of DVD-R discs; “General” and “Authoring”. This has caused some compatibility issues as the lasers in the players for these discs need to be angled differently. Professional DVD players will have both lasers, however if you are using a domestic model it is important to check which discs your player is compatible with. This is also true for all other types of disc as there is unfortunately a lack of compatibility between playback equipment at this time. DVD is a rapidly developing technology and there is a continued push to increase the amount of data that can be stored on a disc.
E
Echo A wave which has been reflected at one or more points in the transmission medium. Echoes may be leading or lagging the primary signal, and appear in the picture monitor as reflections or double images commonly known as ghosts.
Edge curl Usually occurs on the outside one-sixteenth inch of the videotape. If the tape is sufficiently deformed it will not make proper contact with the playback heads. An upper curl (audio edge) crease may affect sound quality. A lower curl (control track) may result in poor picture quality
Edge damage Physical distortion of the bottom edge of the magnetic tape, usually caused by pack problems such as popped strands or stepping. Edge damage effects audio and control track, sometimes preventing playback.
EDL (edit decision list) An EDL can be a handwritten list or computerized set of instructions used to direct the final outline editing assembly of the video programs.
EIAJ Standard tape format for 1/2” VTRs after 1969.
Embrittlement A tape binder condition resulting from polymers that have chemically meshed & tightened resulting in a less supple tape.
Erasure Loss of signal on the tape, resulting from extreme temperatures defined as above 275 F/175 C.
Error correction The data in magnetic recordings can be corrupted due to dropout, poor tracking, poor head noise in the replay circuits and heads. In optical recordings the light beam might be interrupted by scratches or dirt or the disc might be warped. Whatever the causes there are two types of error - large isolated corruptions where a clump of bits are in error or random errors effecting single bits. Error correction is entirely necessary in order to maximize the efficiency of recorders. In the binary world of digital media a bit can only be right or wrong. Therefore if you know which bits need correcting, all that needs to be done is for the value of the bit to be inverted. However, the difficulty is in predicting which bits are in error. This is done by adding what is known as redundancy. Redundancy is information added to the data about the data, the resulting unit is called a code word. Code words are more robust than data alone and enable the error correction mechanism to detect errors and correct them. If it is not possible to correct all the errors then the uncorrected errors are concealed. Concealment may be detectable as it is only the approximation of the information in error whereas corrected data is not detectable and perfectly accurate.
Exhibition format Tape or disc copies that are used expressly for frequent playback, as opposed to master tapes should only be played as part of the archival process. The criteria for a good exhibition format are different from that of an archival format. For example hard disc, DVD and laser disc are all good exhibition formats for video as they are reliable and because playback is made possible without mechanical deterioration to the media as a result of being played. This is important where a video is on display all day every day. Although in the near future it is likely that we will see uncompressed digital video being streamed from hard discs for display, it is more common that the video is compressed. Such compression would not be acceptable for the master copy but may be a compromise that is acceptable for display. Each media type has different advantages and disadvantages, but the important point is to be clear that the criteria for display may be different than for archiving for example the display of a complex video work may require reliable frame-accurate synchronization.
F
Flagging A horizontal displacement of the upper portion of a picture. See skewing.
Flicker Picture distortion mainly related to vertical syncs and video fields display. Some flicker typically exists due to interlacing and is more apparent in 50HZ systems (PAL). Flicker also shows when static images are displayed on the screen, such as computer generated text transferred to video. Poor digital image treatment, found in low quality system converters (going from PAL to NTSC and vice versa) creates annoying flicker on the screen. There are several electronic methods to eliminate flicker.
Flutter Very short rapid variations in tape speed which may result in a jumpy or jittery picture.
Foldover Tape that has folded over resulting in the oxide surface facing away from the heads.
Format See videotape formats.
Frame One complete video picture. A frame contains two video fields, scanned at the NTSC rate of 30 frames per second, 525 lines, or the PAL rate of 25 frames per second, 625 lines.
Frequency A measurement of an analog signal’s vibration, represented as cycles per second or Hertz (Hz).
G
Gamma correction A process used with video and computer graphics images to correct brightness and internal micro-contrast within the image, allowing a change of ratio between the brightest red component of an image and the weakest red.
Gamut The range of voltages allowed from a video signal, or a component of a video signal. Signal voltages outside of the range (i.e., exceeding the gamut) may lead to clipping, crosstalk or other distortions.
Generation Copy of original video program material. The original videotaped material (source footage) is the first generation. A copy of the original is a second generation tape and so on. Generally the edited master tape is a second generation tape. In analog systems, extensive efforts are made to keep generations to a minimum, since each copy or process adds noise and other artifacts resulting in diminished quality with each generation.
Generational loss Degradation cause by tape duplication.
Ghost A shadowy or weak image in the received picture, offset either to the right or to the left of the primary image, and the result of transmission conditions where secondary signals are created and received earlier or later than the primary signal caused by a reflected RF signal.
Glitch A form of low frequency interference, appearing as a narrow horizontal bar moving vertically across the picture.
H
Head Magnetic pickup device in a VTR used to record, erase or reproduce video and audio signals.
Head clogging The accumulation of debris on one or more heads, usually causing poor picture clarity during playback. Clogging of the playback head with debris causes dropout.
Head switching There are two write heads mounted on the video head assembly. The write heads are mounted 180 degrees apart. The videotape is wound on the head drum at slightly more than 180 degrees. This allows for a slight overlap in information between the heads. The video head rotates under the tape so that the tape travels at one speed and the video head travels underneath at a much higher speed. The tracks are scanned alternately by the “A” head and the “B” head. Each track corresponds to one field of the interlaced video signal.
During the playback of the tape, the video heads are timed to avoid double playing the redundant region. The video head switching pulse falls in the “blacker than black” area below the bottom of the television. However, it can be seen by adjusting the vertical hold control so that the vertical sync pulse moves into the viewing area. Any picture disturbance during the head switch over should be hidden by the vertical over-scanning on a TV or monitor. The head drum and capstone drive form a very precise control system known as a servo. Poor servo tension can cause a large switching error that is visible in the picture.
Helical scan A method of recording video information on a tape resulting in recorded parallel tracks that run diagonally across the tape from one edge to the other.
Horizontal Resolution Chrominance and luminance resolution (detail) expressed horizontally across a picture tube. This is usually expressed as a number of black to white transitions or lines that can be differentiated. Limited by bandwidth of the video signal or equipment.
Hue (Tint, Phase, Chroma Phase) One of the characteristics that distinguishes one color from another. Hue defines color on the basis of its position on the spectrum, i.e., whether red, blue, green or yellow, etc. Hue is one of the 3 characteristics of television color, along with saturation and luminance. In NTSC and PAL video signals, the hue information at any particular point in the picture is conveyed by the corresponding instantaneous phase of the active video subcarrier.
Hydrolysis The chemical process in which scission or a chemical bond occurs via reaction with water. The polyester chemical bonds in tape binder polymers are subject to hydrolysis, producing alcohol and acid end groups. Hydrolysis is a reversible reaction, meaning that the alcohol and acid group can react with each other to produce a polyester bond and was as a byproduct. In practice, however, a severely degraded tape binder layer will never fully reconstruct back to its original integrity when placed in a very low humidity environment. See image.\
I
Interlaced (See also: noninterlaced) (Short for interlaced scanning) A system of video scanning whereby the odd- and even- numbered lines of a picture are transmitted consecutively as two separate interleaved fields. Also called line interlace.
IRE (Institute of Radio Engineers) Units of measurement dividing the area from the bottom of sync to peak white level into 140 equal units. 140 IRE equals 1V p-p. The range of active video is 100 IRE.
J
Jitter Small and rapid variations in a waveform due to mechanical disturbances, changes in the characteristics of components, supply voltages, imperfect synchronizing signals, circuits, etc.
L
Laser disc A form of optical media that, unlike DVD, stores video as a composite analog signal. The laser disc was first introduced by Philips and MCA in 1972, and has been on the market since 1978. Laser discs can be glass or plastic. There are essentially two types of laser disc: those mastered for constant linear velocity (CLV) and those mastered for constant angular velocity (CAV). CAV store approximately 30 minutes of video, can be controlled in a frame-accurate way and can be still framed. CLV discs can store approximately one hour of video but cannot be controlled frame-accurately and cannot be still-framed. Once a popular display format for many artists, the laser disc has now largely been superseded by DVD. Laser discs could not handle saturated areas of color, and would produce artifacts appearing as herring bone patterns. CAV discs did, however, have the advantage of frame-accurate external control.
LTC (Longitudinal Time Code) Another expression for the SMPTE time code signal recorded onto the third audio track of a videocassette tape.
Lubricant loss The loss of a component added to the magnetic layer of a tape to decrease the friction between the head and the tape. See image.
Luminance (Luma) The portion of the video signal which contains the black and white information. Luminance indicates the amount of light intensity in a picture which is perceived by the eye as brightness. The color video picture information contains two components: luminance (brightness and contrast) and chrominance (hue and saturation).
M
Magnetic media Tape and discs that store information on a magnetized surface such as videotape, audiotape or computer floppy discs. See image.
Magnetic Particles Elements incorporated in the binder to form the magnetic layer - or coat -on magnetic tape. The signal is recording on these particles. See image.\
Magnetic remanence The ability of the pigment to retain a magnetic field.
MARC Machine Readable Cataloging. The standard system for computerizing cataloging records. IN US, also called USMARC, and systems may vary internationally, e.g., DenMARC. See IMAP website for more information: http://www.imappreserve.org/faq.html
Master The earliest generation of a finished tape that should also be of the best quality. Masters should not be used as exhibition tapes, i.e., not for repeated playback. See also dubmaster.
Migration, re-mastering, transferring Terms used interchangeably to refer to the process of copying the content of an existing videotape to new media.
Mistracking The phenomenon that occurs when the path followed by the read head of the recorder does not correspond to the location of the recorded track on the magnetic tape. Mistracking can occur both longitudinal and helical scan recording systems. The read head must capture a given percentage of the track in order to produce a signal for playback.
Moire 1. A wavy or satiny effect produced by the convergence of lines. It usually appears as a curving of the lines in the horizontal wedges of a test pattern. It is a natural optical effect when converging lines in a television picture are nearly parallel to the scanning lines. 2. Optical disturbance caused by interference of similar\ frequencies.
N
Noise Any unwanted signal present in the total signal.
Nondrop Frame Time Code (NTSC) SMPTE time code format that continuously counts a full 30 frames per second. Because NTSC video does not operate at exactly 30 frames per second, nondrop frame time code will count 108 more frames in one hour than actually occur in the NTSC video in one hour. The result is incorrect synchronization of time code with clock time. Drop frame time code solves this problem by skipping or dropping 2 frame numbers per minute, except at the tens of the minute count.
Noninterlaced The process of scanning whereby every line in the picture is scanned during the vertical sweep. See interlaced.
NTSC (National Television Systems Committee) The US standard for color television transmission, calling for 525 lines of information, scanned at a rate of 30 frames per second. NTSC standard is used mainly in North America, Japan, and part of South America. One of three international standards, including PAL and SECAM.
NTSC Color Bars A pattern generated by the NTSC Generator, consisting of eight equal width color bars. Colors are white (75%), black (7.5% setup level), 75% saturated pure colors red, green, and blue, and 75% saturated hues of yellow, cyan, and magenta (mixtures of two colors in 1:1 ratio without third color).
O
Off-Line Editing that is done using inexpensive, nonbroadcast quality equipment to produce an edit decision list (EDL) which will be used later for assembling a broadcast quality program using more expensive, high quality equipment.
Online Editing Final editing session in which the finished program master is assembled from the original production material.
P
Pack slip A lateral slip of select tape windings causing high or low spots (when viewed with tape reel lying flat on one side) in an otherwise smooth tape pack. Pack slip can cause subsequent edge damage when the tape is played, as it will unwind unevenly and may make contact with the tape reel flange.
PAL (Phase Alternate Line): The European standard for color television transmission, calling for 625 lines of information, scanned at a rate of 25 frames per second. Used mainly in Europe, China, Malaysia, Australia, New
Zealand, the Middle East and parts of Africa. One of three international standards, including NTSC and SECAM.
Pigment An old technology carryover term for the magnetic particles contained in tape binder. See image.
Physical damage Any distortion of the magnetic tape which prevents proper head to tape contact and is therefore detrimental to the tape playback. These distortions can include edge damage, wrinkles, cinches, and tape stretch. See image.
Pedestal 1. In the video waveform, the signal level corresponding to black. Also called setup. 2. A pulse (usually with a flat peak) that elevates the base level of another waveform.
Phase (Chroma Phase, Hue, Tint) The relative timing of a signal in relation to another signal. If the time for one cycle of a signal is represented as a 360 degree along a time axis, the phase position for the second signal is called phase angle expressed in degrees. The subcarrier phase TV colors can be adjusted and this makes the hue signal of a color signal correct. Color phase is the timing relationship in a video that is measured in degrees and keeps the colors themselves.
Playback The viewing of recorded video footage or reproduction of recording video signal via a magnetic pickup device.
Playback demagnetization A loss of magnetization and thus a degradation of recorded information caused by repeated playing of a recorded tape.
PLUGE (Picture Line-Up Generation Equipment) Also called Black Set. Used for aligning monitors and other video devices. In some versions of color bars, PLUGE is the black set at the bottom of the red bar that contains bars that are blacker than black, black, and whiter than black. Used to adjust monitor brightness by watching the PLUGE so that the whiter than black bar is just visible and both the black and blacker than black bars are no longer distinct.
Polymer A long organic molecule made up of small, repeating units (literally, many mers). Analogous to a freight train, where each individual unit is represented by a freight car. At very high magnification, a chunk of polymer would resemble a bowl of cooked spaghetti. Plastic materials are polymers. The strength and toughness of plastics is due, in part, to the length of its polymer molecules. If the chains (links in the freight train) are broken by hydrolysis, the shorter chains will impart less strength to the plastic. If enough polymer chains are broken, the plastic will become weak, powdery, or gooey. See binder.
Popped strand A strand of tape protruding from the edge of a wound tape pack.
Preservation See Video preservation.
Print through The condition where low frequency signals on one tape winding imprint themselves on the immediate adjacent tape windings. It is most noticeable on audio recordings where a ghost of a recording can be heard slightly before playback of the actual recording.
R
Remastering, migration, transferring Terms used interchangeably to refer to the process of copying the content of an existing videotape to new media.
Resolution A measure of the ability of a camera or television system to reproduce detail (the number of picture elements that can be produced with good definition).
Restoration The process and work of improving the degraded quality of the sound or image in terms of video and audio preservation. It is important to be clear whether a proposed restoration relates to aspects of an image that are part of the historical nature of the technology being used at the time and are part of the original work and damage which has occurred after the piece was made due to deterioration, poor handling or bad transfers. It is important to recognize that the artifacts of the original technology are of historical value and are part of the texture of the work. These should not be removed. However, where damage has occurred after the work was finished there may be a case for intervention. Dropout, for example, can be digitally “filled in” by copying information from the surrounding areas. There are also systems that detect artifacts in the image using motion compensation. A copy of the original un-restored video should always be archived alongside any restored version.
RGB (Red, Green and Blue) The basic parallel component set in which a signal is used for each primary color; or the related equipment or interconnect formats or standards. The same signals may also be called “GBR” as a reminder of the mechanical sequence of connections in the SMPTE interconnect standard.
Roll A lack of vertical synchronization which causes the video picture to move upward or downward.
S
Saturation (Chroma, Chroma Gain, Color): 1. The intensity of the colors in the active picture. The voltage levels of colors. The degree by which the eye perceives a color as departing from a gray or white scale of the same brightness. A 100% saturated color does not contain any white; adding white reduces saturation. In NTSC and PAL video signals, the color saturation at any particular instant in the picture is conveyed by the corresponding instantaneous amplitude of the active video subcarrier. 2. The point on the operational curve of an amplifier at which an increase an input amplitude will no longer result in an increase in amplitude at the output.
Scanning The rapid movement of the electron beam in a pickup device of a camera or in the CRT of a television receiver. It is formatted in a line-for-line manner across the photo sensitive surface which produces or reproduces the video picture. When referred to a video surveillance field, it is the panning or the horizontal camera motion.
Scratching Gouging of the magnetic layer or base as the tape passes through a machine. Videotape scratches will cause a loss of head to tape contact and appear as a solid line on the screen.
SECAM (Sequential Couleur Avec Memoir “sequential color with memory”) A color television standard with 625 lines per frame and 50 fields per second developed by France and the U.S.S.R. Color difference information is transmitted sequentially on alternate lines as an FM signal. One of three international standards, including NTSCPAL. and
Shedding Loose oxide may clog video heads causing a loss of picture. See image. A condition in which the oxide that forms the recording surface of a videotape has begun to separate from the base.
Signal Analog video signal is an electrical signal that is continuously variable. Digital video signal is comprised of binary digits.
Signal to noise ratio (S/N) Expressed in decibels (dBs), this term describes a ratio or difference of wanted audible or visual information (signal) versus unwanted information experienced by distorted sounds and pictures (noise). Comparatively high decibel numbers mean better sound or visual images.
Sine wave Type of pure waveform having an equal distance from its peak to the zero or center line and from its trough to the center line and in which the positive hump and negative hump of the wave are exactly equal in length, shape and height but flipped in a mirror image about the center line.
Skew A bending of picture at or bottom of television screen caused by the changing of the video track angles on the tape from the time of recording to the time of playback. This can occur as a result of poor tension regulation by the VCR or by ambient conditions which affect the tape.
SMPTE (Society of Motion Picture and Television Engineers) Organization dedicated to researching, proposing, and promoting video standards.
SMPTE Time Code Time code that conforms to SMPTE standards. It consists of an 8-digit number specifying hours: minutes: seconds: frames. Each number identifies one frame on a videotape. SMPTE time code may be of either the frop-frame or non-drop frame type. In GVG editors, the SMPTE time code mode enables the editor to read either drop-frame or non-drop frame code from tape and perform calculations for either type (also called mixed time code).
Snow 1. White flashes appearing in the video image caused by random noise and/or loss of magnetic particles. 2. TV signal breakup caused by weak video reception.
Squeal Undesirable audio effect that is typically caused by a buildup of debris on a guide or head. Sometimes a cleaning of the offending surface will eliminate the squeal. Squeal is also caused by the tape having poor lubrication or losing its lubrication with age. A solution is to overcoat a tape with a lubricant solution, which will eliminate the squeal so a copy can be made.
Standards A set of common guidelines such as for recording and playback processes, physical media and storage, which have been developed by the following committees:
AIIM - Association for Information and Image Management
ANSI - American National Standards Institute
ASTM - American Society for Testing and Materials
ISO - International Standards Organization
NISO - National Information Standards Organization
RLG - Research Libraries Group
Stepping Unsmooth packing, with transversally mispositioned sections.
Stick slip The process in which (1) the tape sticks to the recording head because of high friction; (2) the tape tension builds because the tape is not moving at the head; (3) the tape tension level reaches a critical level, causing the tape to release from and briefly slip past the read head at high speed; (4) the tape slows to normal speed and once again sticks to the recording head; (5) this process is repeated indefinitely. Characterized by jittery movement of the tape in the transport and/or audible squealing of the tape. See image.
Sticky shed The gummy deposits left on tape path guides and heads after a sticky tape had been played. Sticky shed is also known as the phenomenon whereby a tape binder has deteriorated to such a degree that it lacks sufficient cohesive strength so that the magnetic coating sheds on playback. The shedding of particles by the tape is a result of binder deterioration that causes dropout on VHS tapes. See image.
Sticky tape Tape characterized by a soft, gummy, or tacky tape surface; tape that has experienced a significant level of hydrolysis so that the magnetic coating is softer than normal; tape characterized by resinous or oily deposits on the surface of the magnetic tape. See image.
Subcarrier The basic signal in all NTSC sync signals. It is a continuous sine wave, usually generated and distributed at 2V in an amplitude, and having a frequency of 3.579545MHz. Subcarrier is usually divided down from a primary crystal running at 14.318180MHz, and that divided by 4 is 3.579545. All other synchronizing signals are directly divided down from the subcarrier. Color subcarrier is the 3.58 MHz signal that carries color information. This signal is superimposed on the luminance level. Amplitude of the color subcarrier represents saturation, and phase angle represents hue.
Substrate An alternate term for backing film. The layer that supports the magnetic layer in a magnetic tape, most commonly made of polyethylene terephthalate (PET). See image.
Sync (abbreviation for synchronous) The portion of an encoded video signal that occurs during blanking and is used to synchronize the operation of cameras, monitors and other equipment. Horizontal sync occurs within the blanking period in each horizontal scanning line and vertical sync occurs within the vertical blanking period. In video, sync is an essential element for maintaining the proper clocking of video signals. \
T
Tape clog See head clogging.
TBC (Time Base Corrector) Hardware that corrects the timing irregularities that occur during VCR playback. Time base correction is not necessary for direct playback from a VCR to a TV set.
Time base error A variation in the synchronizing signals on a videotape. When time based errors are large enough, they may cause skewing or flagging distortion of the video picture.
Time code tape for logging time code. See also SMPTE time code. Electronic indexing method used for editing and timing video programs. Time code denotes hours, minutes, seconds and frames elapsed on videotape. Time code permits very time efficient and accurate editing, and is displayed in a “window dub”
Tracking The angle and speed at which the tape passes the video heads. Loss of tracking is evidenced by picture breakup or loss of video in segments of the picture.
Transcoder A device that converts one form of encoded video to another, e.g. to convert NTSC or PAL. Sometimes mistakably used to mean translator.
Transferring, migration, re-mastering
Trapezoidal error A change in the angle of a recorded helical scan track. Can result in mistracking.
V
Vectorscope Oscilloscope that reads chrominance portion of a video signal. See waveform.
Videotape See image.
Videotape formats Recording formats. Current video tape formats include C, U-matic, Betacam M, Betcam SP, Mll, D1, D2, video to Terms used interchangeably to refer to the process of copying the content of an existing videotape to new media. Oxide-coated plastic-based magnetic tape used for recording video and audio signals. that differ in magnetic patterns of information, but rely on the same fundamental process of recording image and sound on magnetic tape. A particular format needs its own playback machine that is able that to read the magnetic pattern. There are several characteristics that distinguish one format from another, such as the type of recorded signal, tape speed, width and placement of the video tracks and audio tracks. After 1970 the EAIJ standard was accomplished. The VHS (video home system) 1/2” consumer videotape format is one example. Since 1956, approximately 50 formats have been introduced worldwide. For examples, see the resources Hardware section. D3, D5, Digital Betacam, Beta, VHS, Hi-*, 8mm, S-VHS, DVC Pro and DVcam.
Video preservation An archival system that ensures the survival in perpetuity of the program content according to the highest technical standards reasonably available. There are three major facets of video preservation: (1) safeguarding the recording under secure and favorable storage conditions, (2) providing for its proper restoration and periodic transfer to modern formats before the original or next generation copy is no longer technologically supportable, and (3) continuing protective maintenance of at least a master and a copy, physically separated in storage, preferably in different geographic locations. (From the National Film Preservation Board’s Television/Video Preservation Study: Volume 1: Report 1997.)
Video signal to noise ratio An indication of the amount of noise in a black and white picture.
Viewing copy A videotape dubbed from a master and made for repeated viewing. See exhibition format.
Vinegar syndrome Characteristic of the decomposition of acetate-based magnetic tape where acetic acid is a substantial by product that gives the tape a vinegar-like odor. After the onset of the vinegar syndrome, acetate tape backing shydrolysis of the acetate is catalyzed further by the presence of acetate acid byproduct.
W
Waveform Oscilloscope that reads luminance and other parts of the composite sync, blanking, video, etc. that may need adjustment for accurate display. See vectorscope.
White balance An electronic process used in video cameras to retain true colors.
Window dub time code.
Windowing Interlayer slippage or magnetic tape in roll form, resulting in bucking of some strands of tape. The tape will in many cases fold over itself causing permanent vertical crease in the tape. Also, if not fixed, will cause increased dropout. See cinching.
Wrinkle A physical deformity of the videotape; any or wrinkle in the videotape may produce dropout or loss of picture information upon playback. See creasing. Copies of videotape with “burnt in” time code display. Hours, minutes, seconds and frames appear on the recorded image. Window dubs are used in off-line editing.
Glossary contributions by Rebecca Bachman*; Pip Laurenson, Sculpture Conservator, Tate UK; Heather Weaver, Online Editor, BAVC; Dr. John Van Bogart; and Snader & Associates Inc.. *Originally published in Playback: A Preservation Primer for Video, Copyright 1998, Bay Area Video Coalition.
Works Cited
Bay Area Video Coalition, New York University Digital Library Technology Services, & Stanford Media Preservation Lab. A/V Artifact Atlas (2015) Retrieved from: http://avaa.bavc.org/artifactatlas/index.php/A/V_Artifact_Atlas
Bay Area Video Coalition. “Help” BAVC/QCTools (2015) Retrieved from: https://github.com/bavc/qctools
Bachman, Rebecca. “Video Preservation: Glossary of Terms” Walker Art Center Archives (1996) Retrieved from: http://cool.conservation-us.org/byorg/bavc/bavcterm.html
Haydon, Kelly. QCSchool Blog Series for QCTools Users. Bay Area Video Coalition (2015) Retrieved from: http://bavc.org/bavc-blog/intro-blog-series-qctools-users